Can The XRP Price Reclaim $3?These Key Metrics Say It Just Might
 2025/07/07 06:30
XRP finally cleared its symmetrical pennant formation on July 3, with the price pushing above the $2.20 region. The breakout wasn’t explosive but came on moderately rising volume, hinting at quiet accumulation.
Currently, the XRP price hovers near $2.27, facing a key resistance confluence at $2.35.
SOPR Suggests Some Profit-Taking, But No Panic
XRP’s SOPR (Spent Output Profit Ratio) spiked above 1.6 in early June 2025, indicating wallets are locking in gains. Historically, such levels have aligned with local tops, especially when profit-taking exceeds 1.5.
 XRP SOPR:
Glassnode
XRP SOPR:
Glassnode
But this time, the XRP price is holding firm, even though 1.5 is still far off. This suggests market strength, or at the very least, strong absorption of profits.
SOPR tracks whether coins moved on-chain are sold at a profit or loss. A value above 1 means sellers are exiting in profit. Current levels indicate some distribution but not enough to derail the trend.
MVRV Z-Score Signals No Euphoria Yet
The MVRV (Market Value to Realized Value) Z-Score, which compares market cap to realized cap, remains relatively tame even after the breakout. It previously peaked near 6.5 during XRP’s $3 run in early 2025 but now hovers near 2.0.
 XRP MVRV-Z indicator suggests room for upside:
Glassnode
XRP MVRV-Z indicator suggests room for upside:
Glassnode
This indicates that XRP is not yet in the danger zone of overvaluation. MVRV Z-Score below 3 suggests further upside could still be on the table before widespread profit-taking kicks in.
MVRV (Market Value to Realized Value) Z-Score measures how far the price has deviated from the average cost basis of all coins. A low score means the asset isn’t overextended relative to historical investor entry points, signaling room to climb before hitting sentiment extremes.
HODL Waves Show Long-Term Holders Are Still Sitting Tight
XRP’s HODL Wave chart paints a picture of strong holder conviction. Over 40% of the circulating supply hasn’t moved in over a year, and long-term cohort bands remain stable despite recent XRP price moves.
 HODL waves showing conviction:
Glassnode
HODL waves showing conviction:
Glassnode
That means long-term investors are not rushing to sell, even during rally phases. This supports the bullish thesis that fewer coins moving means less sell pressure at overhead resistance.
HODL Waves tracks the age of coins in wallets. When coins remain dormant, it often signals belief in higher long-term prices.
Active Addresses Spike Before Each Leg Higher
XRP’s active addresses and wallets transacting in the past 24 hours surged multiple times in June, each time preceding a leg up in XRP price. These activity bursts suggest fresh wallet participation, potentially from new buyers or XRP whales rotating in.
 Active address spike preceding price moves:
XRP Price Breaks Out, But $2.35 Is a Wall
A new pennant formation, on the daily timeline, is now formed. It shows cleaner support and resistance trendlines, suggesting the breakout is technically sound.
If XRP flips $2.35 to support, the next resistance zones lie at $2.48, $2.60, $2.65, and eventually $2.78. A move above $2.78 opens room toward the psychological $3 level, which hasn’t been tested since early 2025.
 A/D line paired with volume shows capital inflow:
However, if the breakout fails and the price drops below $2.08, the bullish structure breaks down, risking a deeper slide.
Also, the Accumulation/Distribution (A/D) line has been slowly trending up since April 2025. While not aggressive, this confirms that capital inflows continue, and whales aren’t aggressively offloading. This indicator weighs price movement against volume; rising trends imply accumulation even without explosive volume. A flat-to-upward slope supports the idea that XRP’s recent breakout is not being sold into heavily.
On-chain and technical signals suggest XRP has momentum behind it, but the $2.35 resistance needs to go. MVRV and SOPR show we aren’t in euphoria yet, while HODL Waves confirms supply remains locked. If the XRP price holds above $2.20 and clears $2.35, $2.65–$2.78 could follow fast. Only a break below $2.08 flips the chart bearish again.
Disclaimer: The content of this article solely reflects the author's opinion and does not represent the platform in any capacity. This article is not intended to serve as a reference for making investment decisions.
You may also like
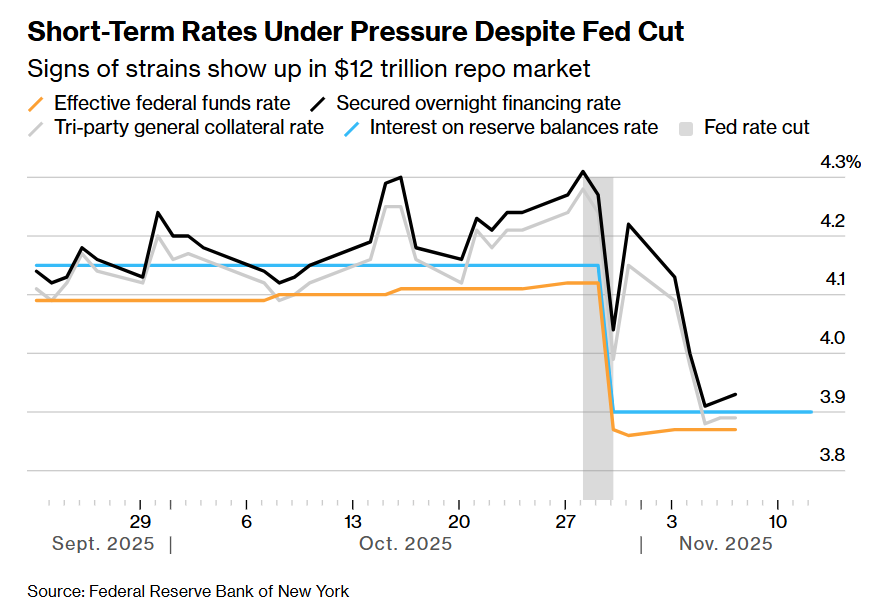
The 12 trillion financing market is in crisis! Institutions urge the Federal Reserve to step up rescue efforts
Wall Street financing costs are rising, highlighting signs of liquidity tightening. Although the Federal Reserve will stop quantitative tightening in December, institutions believe this is not enough and are calling on the Fed to resume bond purchases or increase short-term lending to ease the pressure.
Another Trump 2.0 era tragedy! The largest yen long position in nearly 40 years collapses
As the yen exchange rate hits a nine-month low, investors are pulling back from long positions. With a 300 basis point interest rate differential between the US and Japan, carry trades are dominating the market, putting the yen at further risk of depreciation.
Is a "cliff" in Russian oil production coming? IEA warns: US sanctions on Russia may have "far-reaching consequences"!
U.S. sanctions have dealt a heavy blow to Russia’s oil giants, and the IEA says this could have the most profound impact on the global oil market so far. Although Russian oil exports have not yet seen a significant decline, supply chain risks are spreading across borders.
Leading DEXs on Base and OP will merge and expand deployment to Arc and Ethereum
Uniswap's new proposal reduces LP earnings, while Aero integrates LPs into the entire protocol's cash flow.