

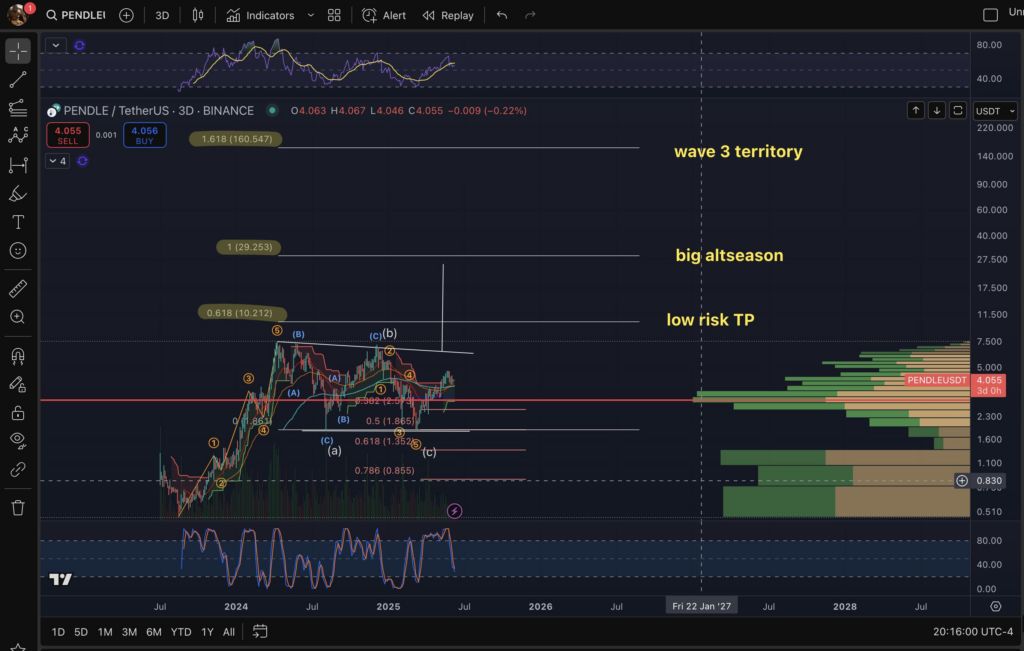
- Pendle structure shows strong buying zones between $1.35 and $1.85 with wave 3 building above $4.00.
- Fibonacci targets place the next technical goals at $10.21 and $29.25 during the ongoing wave buildup.
- Altseason signals increase as Pendle enters volume demand with chart views crossing 2900 in a few hours.
Pendle (PENDLE/USDT) is trading at $4.05 with visible signs of consolidation, forming a potential low-risk setup for larger upside. Technical patterns from a recent chart shared by trader MichaelEWPro on June 9, 2025, indicate strong accumulation and upcoming price expansion. The asset is entering a critical phase defined as “wave 3 territory” and is positioned within broader altseason expectations.
 Source:
X
Source:
X
Accumulation Phase Signals Technical Foundation
The price structure of Pendle reveals layered support between $1.35 and $1.85, with the 0.618 Fibonacci retracement level at $1.35. These levels served as significant bounce zones, reinforcing market interest and short-term stability during previous retracements. The repeated tests of the 0.5 and 0.618 zones imply foundational price support before a strong upward leg.
Data shows that the $0.855 level, marked by the 0.786 retracement, was the lowest point of a corrective wave structure. This zone formed the final part of a visible (A)(B)(C) corrective formation before price reversed. Buyers returned aggressively near this area, pushing the token back toward the $4.00 mark.
Volume profile analysis suggests heightened activity between $1.00 and $5.00, confirming it as a high-demand zone. The trading density between these levels highlights accumulation during sideways price action. Based on this structure, Pendle appears technically poised for breakout if current momentum continues.
Elliott Wave Structure Maps Bullish Roadmap
Elliott Wave projections from the chart highlight wave 3 territory extending above $29.25 with a longer-term target near $160.54. The chart marks this target as the 1.618 Fibonacci extension level, based on prior wave calculations. These forecasts point toward major potential upside under ideal market conditions.
Within the current pattern, wave counts show a complete ABC correction inside a larger wave formation. Smaller internal waves have developed inside the range, leading to minor pullbacks but holding structural integrity. The price is building pressure along the $4.05 range, preparing for the transition into wave 3.
The current wave appears to be forming a base before taking on an extended rally phase aligned with projected Fibonacci targets. This supports the idea of a developing altseason, during which lower-cap coins historically outperform major digital assets. Altseason reference is directly mentioned in the visual annotation of the chart.
As patterns align with bullish continuation structures, a central question emerges: Will Pendle break into wave 3 and lead the altseason?
Market Context and Chart Sentiment Align
The chart posted by MichaelEWPro gained traction early on June 9 and reached nearly 3,000 views within hours. Its structured labeling and technical precision captured attention from altcoin traders looking for potential setups. The terms “low risk TP” and “wave 3 territory” have become talking points among followers.
Stochastic indicators at the bottom of the chart show oversold levels, potentially suggesting near-term upward pressure. This coincides with a clustering of volume nodes around the current price level. Together, these tools suggest the market may be loading for a directional move.
Pendle remains on watch as it consolidates within an established support cluster, suggesting that the current zone offers an attractive trade level. If wave 3 begins, the initial resistance levels at $10.21 and $29.25 will serve as the first technical checkpoints for further upside validation.


