Hedera (HBAR) Tests $0.20 Support as Momentum Wanes

Hedera (HBAR) faces a critical test at $0.20 as technical signals show indecision. Momentum remains fragile, and market sentiment could tip the balance.
Hedera (HBAR) is trading dangerously close to the key psychological level of $0.20, with technical indicators flashing mixed signals. The BBTrend has turned slightly positive at 0.97 but continues to struggle to break above the bullish confirmation level of 1, signaling weak momentum.
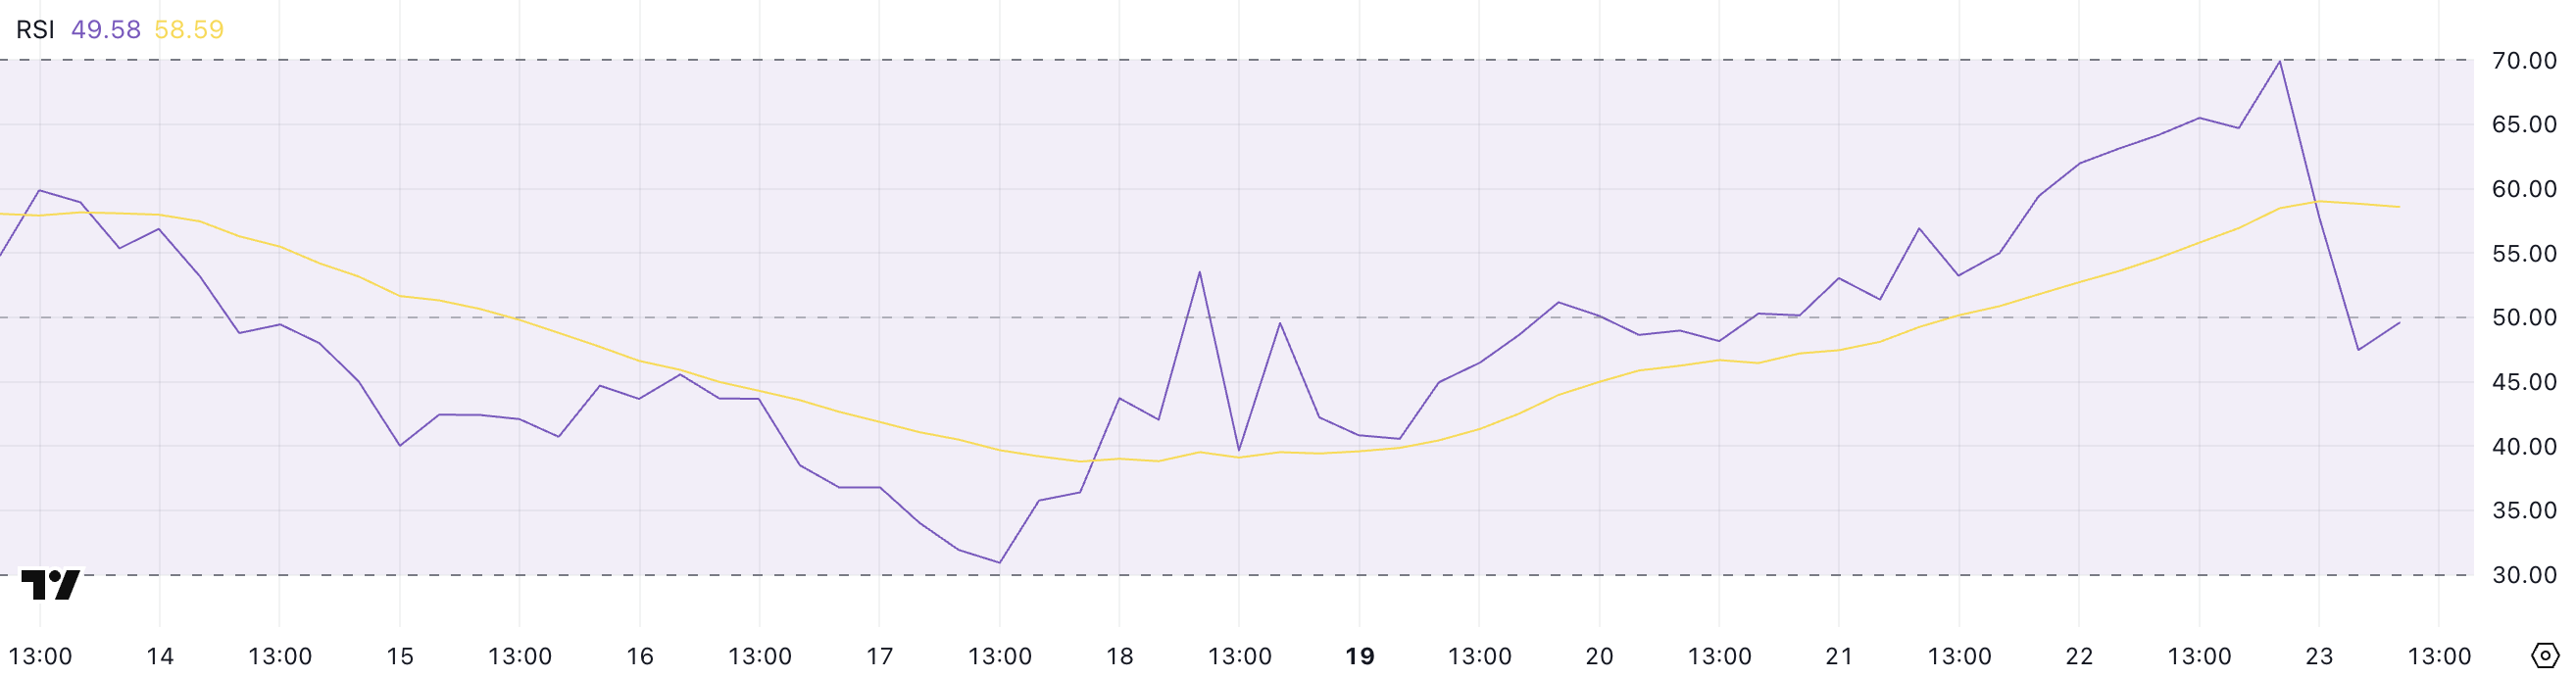
Meanwhile, the RSI has dropped sharply from near-overbought territory to a neutral 49.58, reflecting fading confidence after Bitcoin’s recent decline. With HBAR hovering at a make-or-break level, traders are watching closely to see whether support holds or if a deeper correction happens.
HBAR BBTrend Turns Positive, But Struggles to Confirm Bullish Momentum
The BBTrend (Bollinger Band Trend) indicator measures the strength and direction of price trends based on how far prices deviate from a moving average within the Bollinger Bands.
Positive values suggest upward momentum and buying strength, while negative values indicate downward pressure. The deeper the value, the stronger the trend, making it useful for spotting breakouts or trend reversals.
When BBTrend hovers near zero, it signals indecision or consolidation, and sustained values above 1 are typically seen as confirmation of a bullish move gaining traction.
 HBAR BBTrend. Source:
TradingView.
HBAR BBTrend. Source:
TradingView.
HBAR’s current BBTrend reading of 0.97 marks a recovery from its recent bearish phase, where it bottomed at -8.99 on May 19 and remained negative through May 22.
This return to positive territory suggests momentum is attempting to shift in Hedera’s favor, but the inability to hold above 1 points to fragile bullish conviction.
While the reading reflects an improving trend, it also highlights hesitation from buyers, indicating that HBAR may remain range-bound unless stronger momentum emerges.
Hedera RSI Drops to Neutral Zone Amid BTC-Driven Sell-Off
Hedera’s Relative Strength Index (RSI) has dropped to 49.58, falling sharply from 69.91 just a day earlier.
This sudden shift reflects a clear loss of buying momentum, as broader market sentiment turned risk-off following Bitcoin’s 3% drop in response to Donald Trump’s threat of imposing a 50% tariff on the European Union.
The RSI’s decline highlights how quickly investor confidence in HBAR faded alongside BTC’s pullback, pulling the token back into neutral territory after nearly touching overbought conditions.
 HBAR RSI. Source:
TradingView.
HBAR RSI. Source:
TradingView.
The RSI is a momentum indicator that measures the magnitude of recent price changes to evaluate whether an asset is overbought or oversold.
It ranges from 0 to 100, with levels above 70 typically signaling overbought conditions and potential for a pullback, while values below 30 suggest oversold conditions and potential for a rebound.
With HBAR’s RSI now sitting near the midline, the token lacks a clear trend, indicating indecision among traders. For momentum to return, HBAR would need either renewed bullish sentiment or broader market stabilization—particularly from Bitcoin.
HBAR Nears $0.20 Breakdown — Key Support Levels in Focus
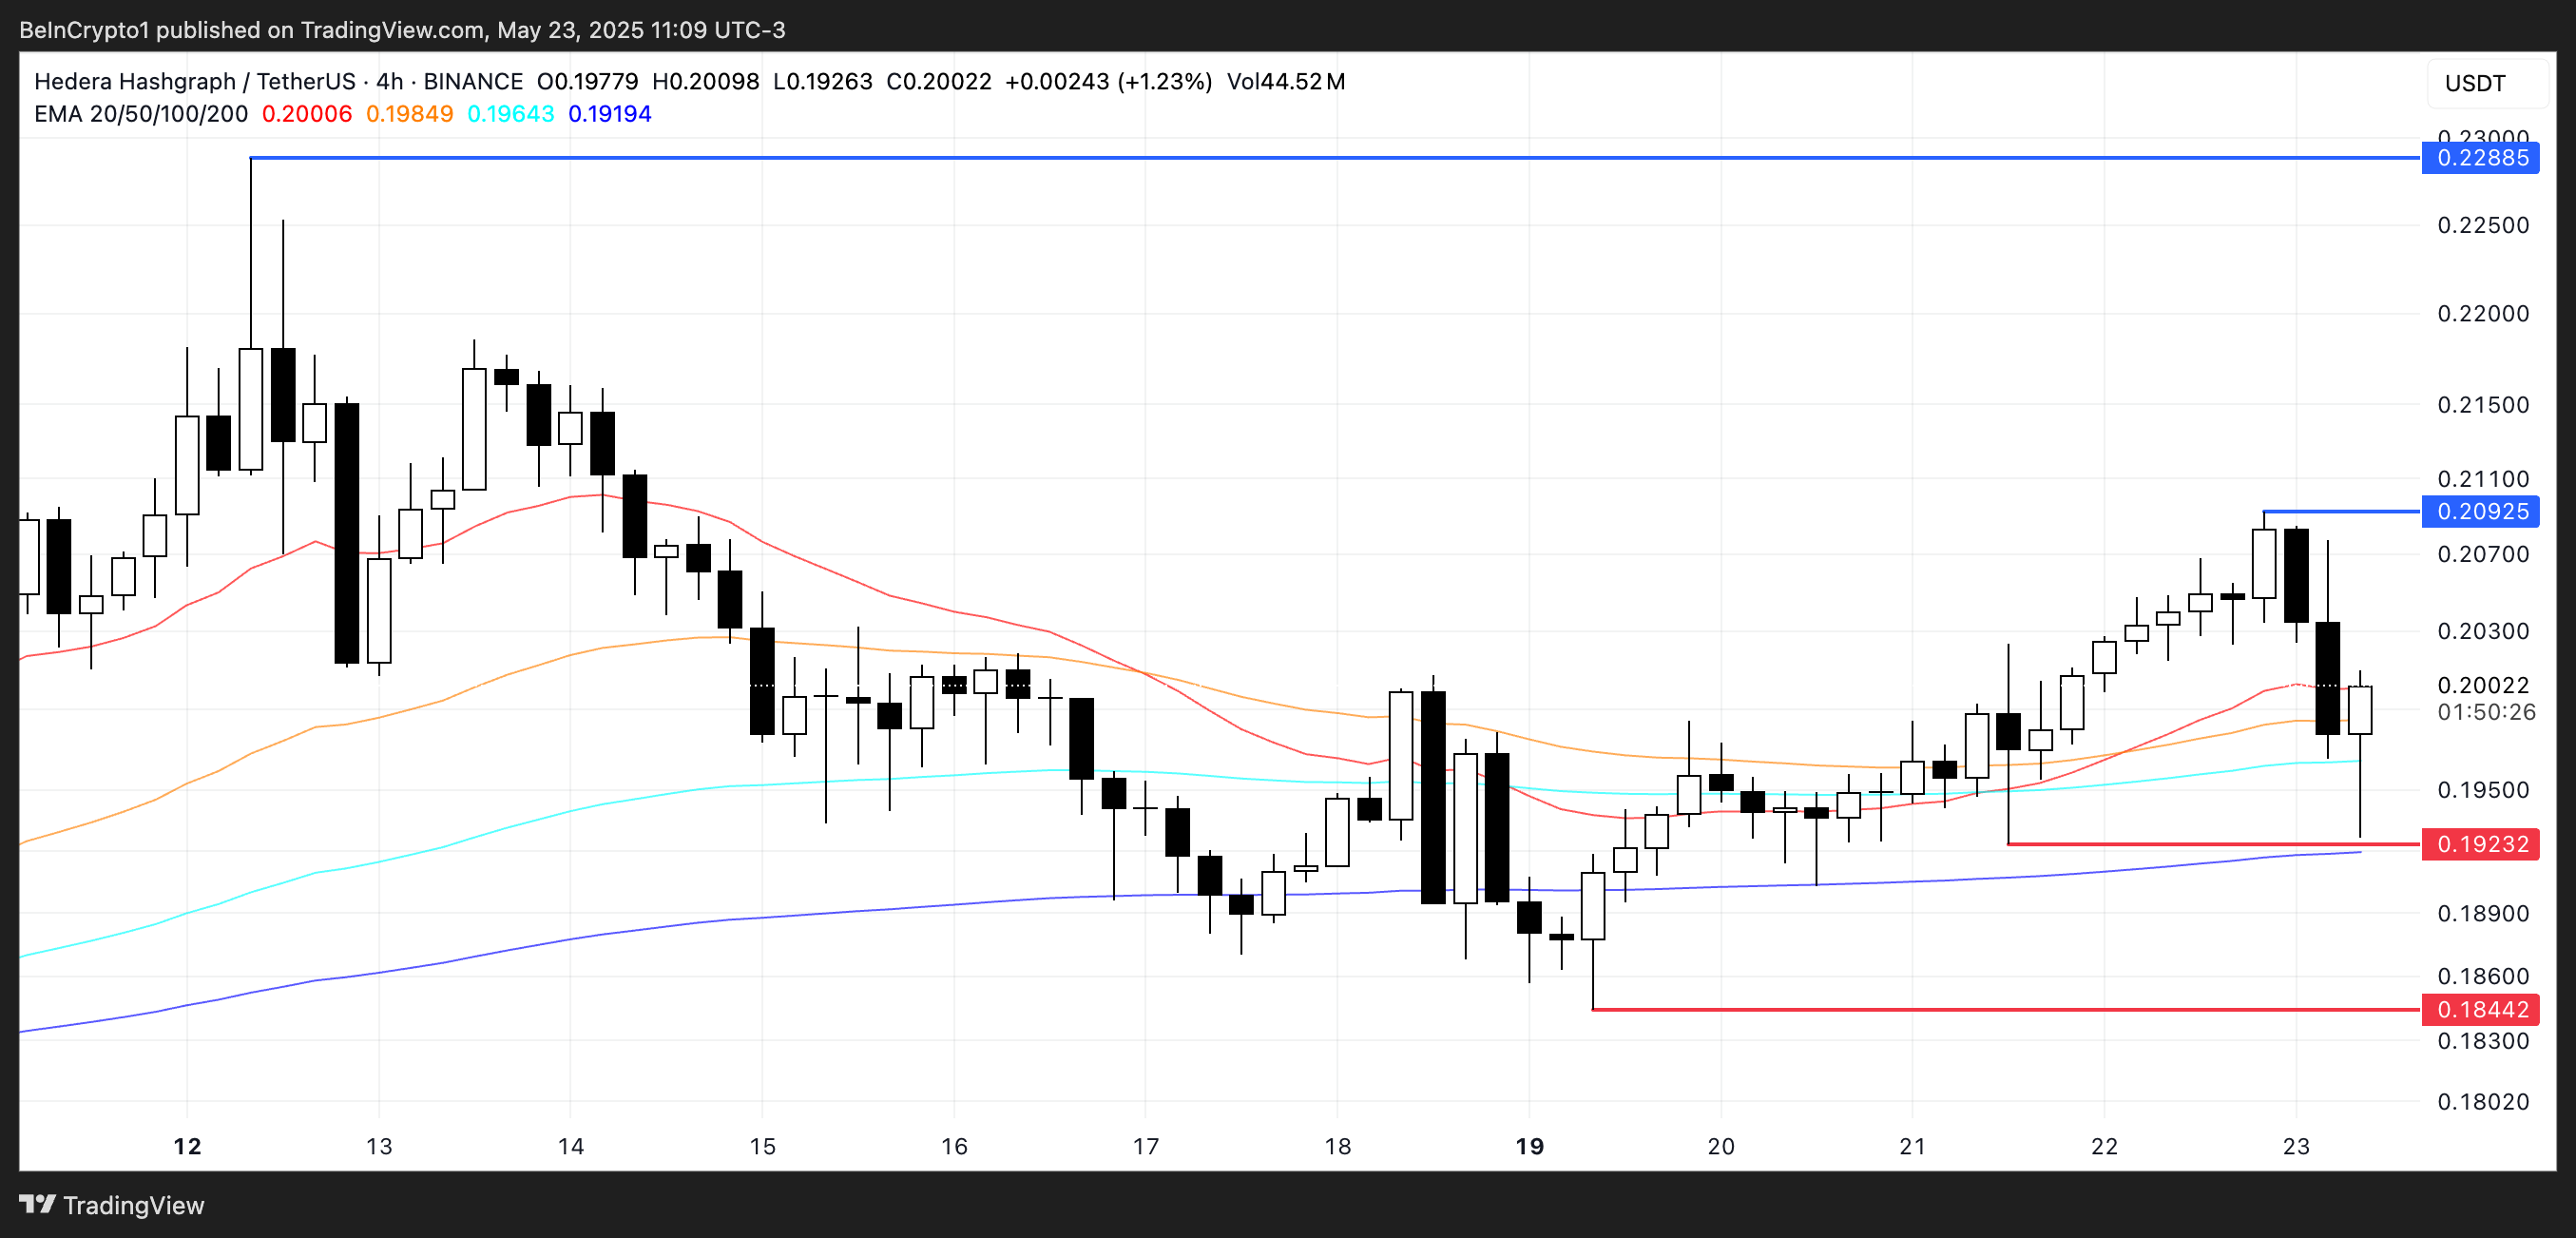
Hedera price is currently at a critical technical juncture, hovering just above the psychological level of $0.20. If bearish momentum persists, the token is at risk of breaking below this level and could slide toward the next support at $0.192.
A breach there would expose further downside to $0.184, potentially accelerating short-term selling pressure.
 HBAR price Analysis. Source:
TradingView.
HBAR price Analysis. Source:
TradingView.
This scenario reflects broader weakness in the crypto market, particularly after Bitcoin’s recent pullback.
However, if sentiment stabilizes and HBAR reverses course, the first resistance to watch is at $0.209. A successful breakout above this level could open the door to a move toward $0.228, a zone that would likely require strong volume and broader market support to reclaim.
Disclaimer: The content of this article solely reflects the author's opinion and does not represent the platform in any capacity. This article is not intended to serve as a reference for making investment decisions.
You may also like
Incubator MEETLabs launches large-scale 3D fishing blockchain game "DeFishing" today
As the first blockchain game on the GamingFi platform, a dual-token P2E system is implemented using the IDOL token and the platform token GFT.

A History of Privacy Development in the Crypto Space
Privacy technologies in the crypto world have never truly broken free from the limitations of being "narrow" and "single-user."
Trading volume surpasses 410 millions, Sun Wukong's first phase "trade mining" report released, excess fee rebates ignite the market
Currently, the first phase of the Sun Wukong trading mining activity has entered its second half. The event will officially conclude at 20:00 (UTC+8) on December 6, 2025.