
Analyst: Bitcoin and Strategy Price Charts Synchronize with Golden Cross, Potential Technical Upsurge Expected
According to CoinDesk, analyst Omkar Godbole released an analysis report indicating that Bitcoin and the price chart of the largest global Bitcoin holder, Strategy, have simultaneously shown a technical bullish signal. The daily charts display the 50-day moving average crossing above the 100-day moving average, forming a "golden cross." Analyst Omkar Godbole pointed out that this simultaneous signal suggests that the short-term trend is surpassing the long-term trend, potentially indicating the start of a major bull market wave.
However, the analyst also noted that on-chain data shows that whale market participants are turning cautious, with the current price encountering resistance in the $101,000 to $107,000 range, and the key support level being $98,000.
Disclaimer: The content of this article solely reflects the author's opinion and does not represent the platform in any capacity. This article is not intended to serve as a reference for making investment decisions.
You may also like
MIT brothers' $25 million Ethereum fraud trial declared a mistrial
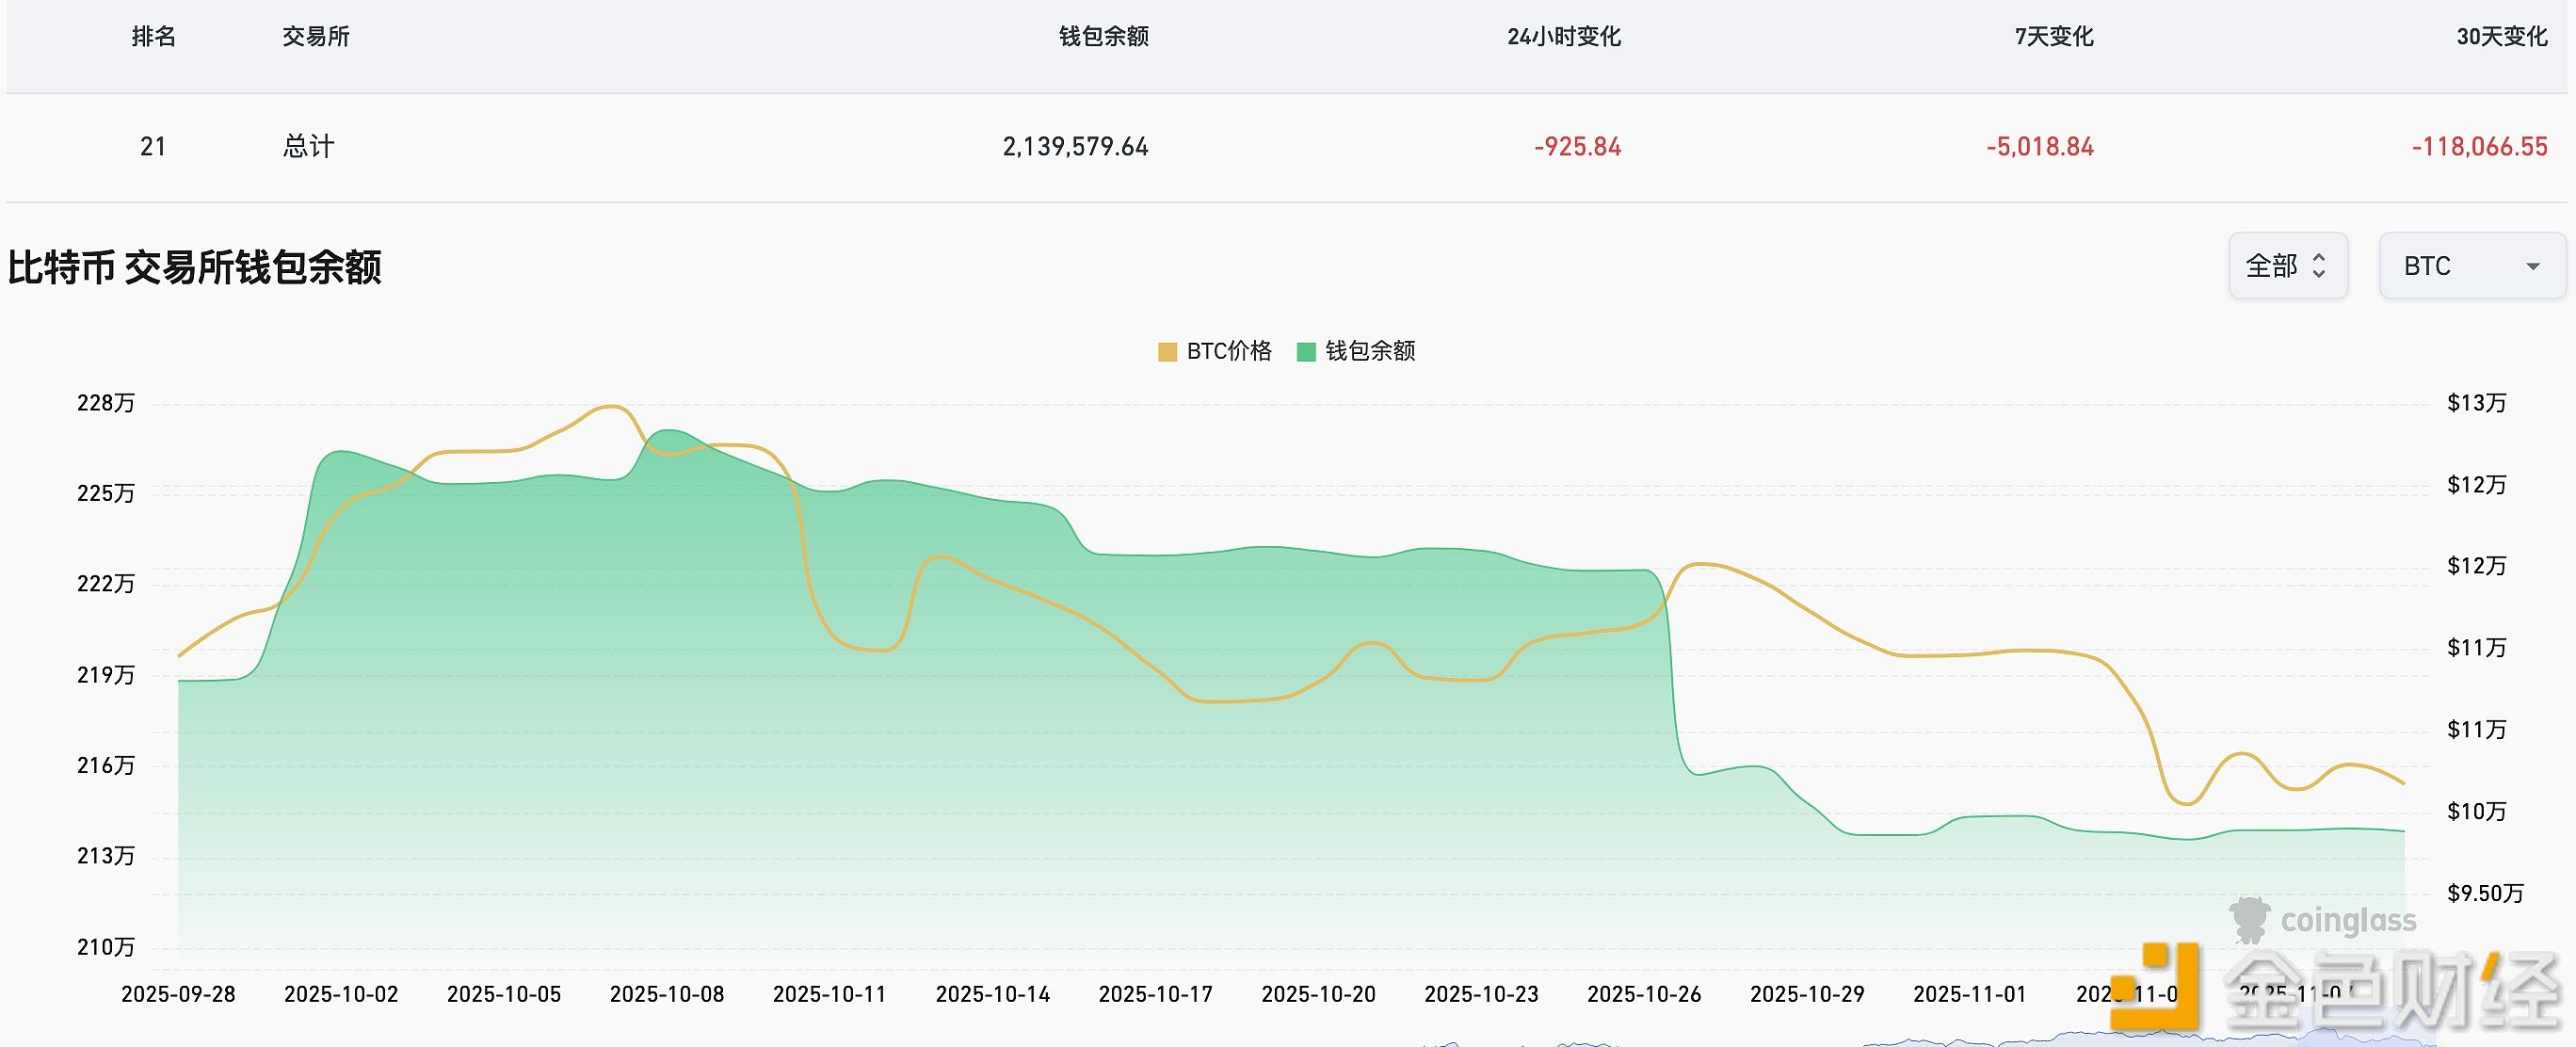
In the past week, 5,018.84 BTC have flowed out of CEX platforms.
RootData: VANA to unlock tokens worth approximately $4.57 million in one week
Analysis: Altseason Signals Hidden in Weeks of Bitcoin Dominance Weakness