
- BOOK OF MEME rallies over 17%, trading at $0.0029.
- BOME’s daily trading volume has jumped by over 122%.
The crypto market cap has reached $3.36 trillion after the recent recovery attempt from the bearish grip. Major assets have entered the bullish territory. Notably, the meme coin market cap is found at around $80 billion, with BOOK OF MEME (BOME) registering a solid 17.25% jump.
In the early hours, BOME traded at a low range of $0.002407. Later, the ignited bullish push has broken through crucial resistances between $0.0025 and $0.0031, triggering the meme coin to climb to a peak of $0.00322.
At the time of writing, BOOK OF MEME traded within the $0.002906 range, with a market cap of $200 million. Consequently, the daily trading volume of the meme coin has increased by 122%, reaching $355 million. Along with the market has witnessed a $1.53 million liquidation in BOME, according to Coinglass.
The BOOK OF MEME price has recorded a gain of over 108% in the last seven days. The week opened trading at the $0.0013 range, and the mighty bullish wave has sent the price to the current trading level.
Could BOME’s Uptrend Signal More Gains Ahead?
BOME’s four-hour price trajectory reports the bullish momentum, triggering the price to find its key resistance at the $0.002965 range. A sustained position above the upper trendline might ignite the golden cross to form, driving the price to break beyond $0.0030.
Assuming the bears are making a comeback, it could likely pull the asset downward to its support at around $0.002871. Failing to hold this level might trigger the emergence of the death cross, opening the gateway for a deeper decline toward $0.0027 or lower.
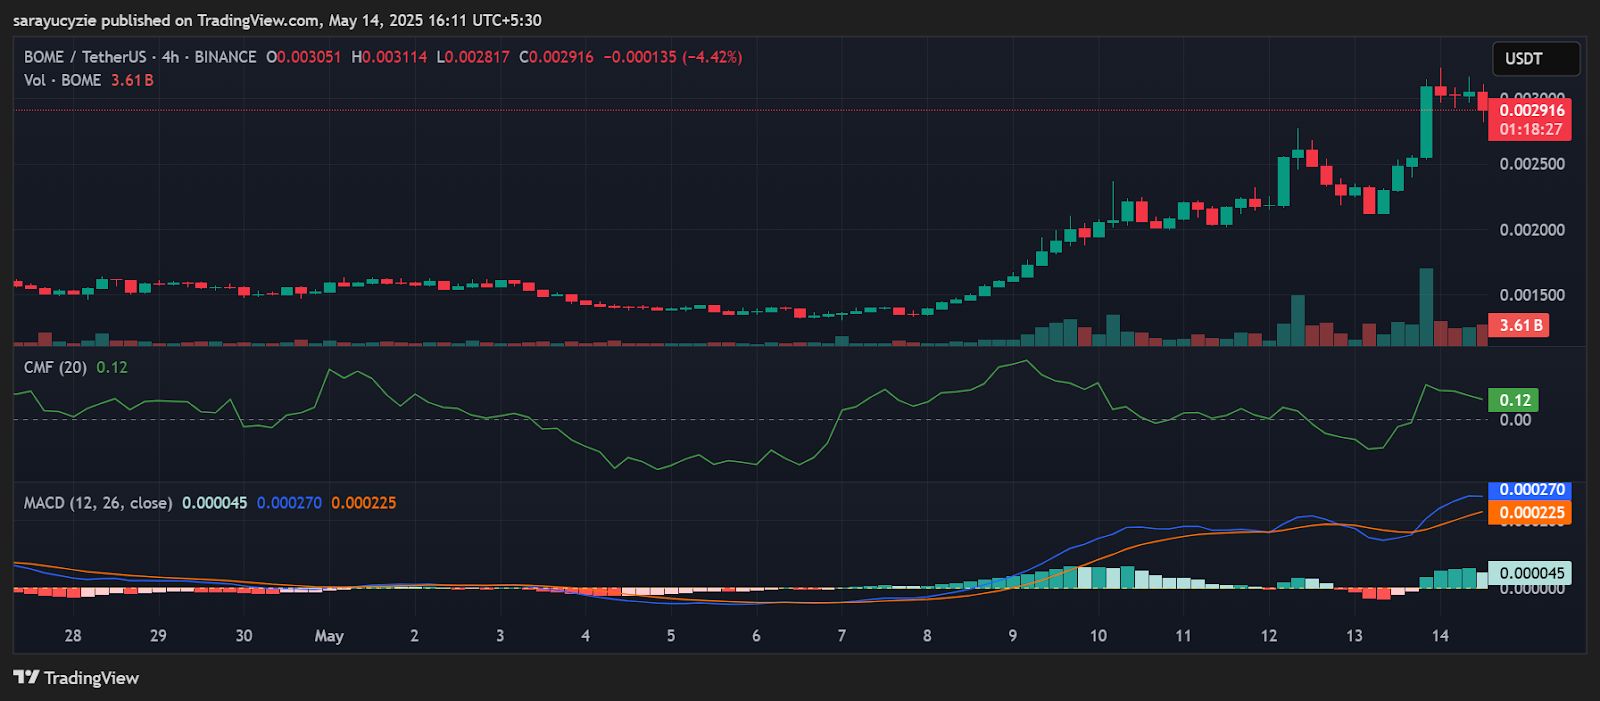 BOME chart (Source: TradingView )
BOOK OF MEME’s Moving Average Convergence Divergence (MACD) line has crossed over the signal line. It typically indicates a bullish crossover, and the upward price movement may continue. Additionally, the asset is experiencing a capital inflow with the Chaikin Money Flow (CMF) indicator stationed at 0.12, which suggests moderate buying pressure in the market, supporting the price strength.
 BOME chart (Source: TradingView )
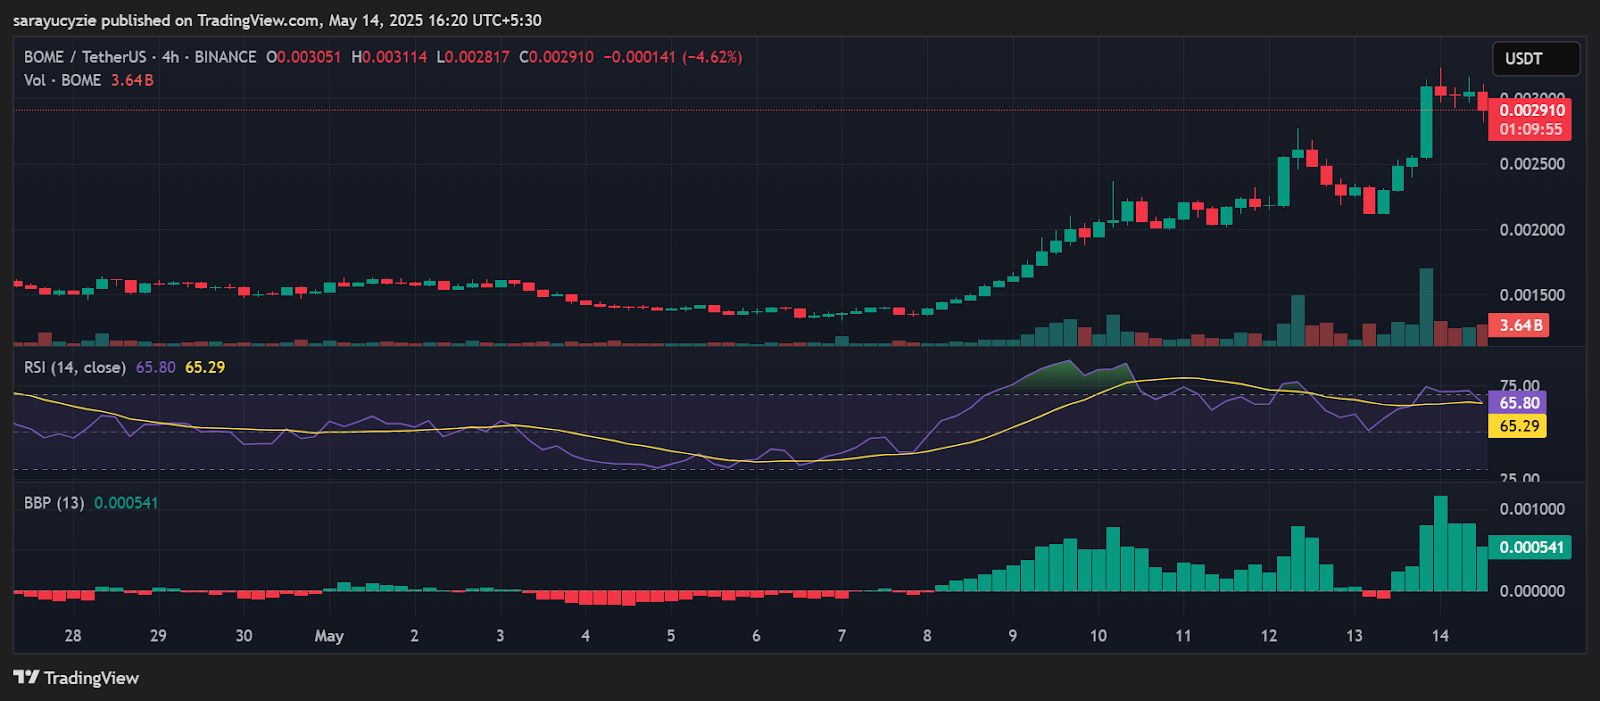
Moreover, the relative strength index (RSI) for the day was found at 65.80, signalling that BOME is approaching the overbought zone, with the potential for a pullback or facing resistance. Its Bull Bear Power (BBP) at 0.000541 hints at a mild dominance of bulls in the market.
Highlighted Crypto News
$3K in Sight: Will Ethereum Bulls Keep the Fire Alive After 8% Jump?