

- XLM’s breakout above $0.293 neckline signals potential move toward Fibonacci targets.
- Rising MACD and near-overbought RSI highlight strong but cautious bullish momentum.
- Recent inflow spikes near $0.38 suggest renewed investor accumulation and market interest.
Stellar (XLM) is showing signs of a strong technical breakout, drawing attention from traders and analysts alike. Recent price action suggests that a bullish reversal could be underway. The token’s price has increased 10.13% over the past 24 hours and shows a similar rise over the last week, turning investor sentiment around XLM optimistic.
The current price of $0.3031 is hovering just above a critical neckline resistance level, which, breached and held, this level may open the path for significant upward movement. Analysts believe the next few trading sessions will be crucial to determine if Stellar confirms this reversal or slips back into a consolidation phase.
Ali Martinez Highlights XLM’s Reversal Pattern
Crypto analyst Ali Martinez has pointed out a possible inverse head-and-shoulders pattern developing on the XLM/USD chart. This pattern is commonly associated with a bullish reversal.
The neckline resistance sits near the $0.293 level, which XLM has recently surpassed. A confirmed breakout above this level may unlock higher price targets based on Fibonacci extension levels. These targets include $0.324, $0.341, $0.367, and potentially $0.391.
However, if XLM fails to hold above this key resistance, it could revisit lower support zones. Critical support levels remain at $0.255 (0.618 Fibonacci), $0.245 (0.5), and $0.236 (0.382). A volume spike around the breakout area would help validate bullish momentum. Without volume confirmation, the breakout risks becoming a false signal.
On-Chain Metrics Suggest Accumulation Trends
Data from the XLM Spot Inflow/Outflow chart offers deeper insights into investor behavior. Between late November and mid-December, massive outflows matched a steep rally from $0.10 to $0.60. This suggests many investors took profits near the top. Subsequent inflows during January and April hint at strategic buying during price dips.
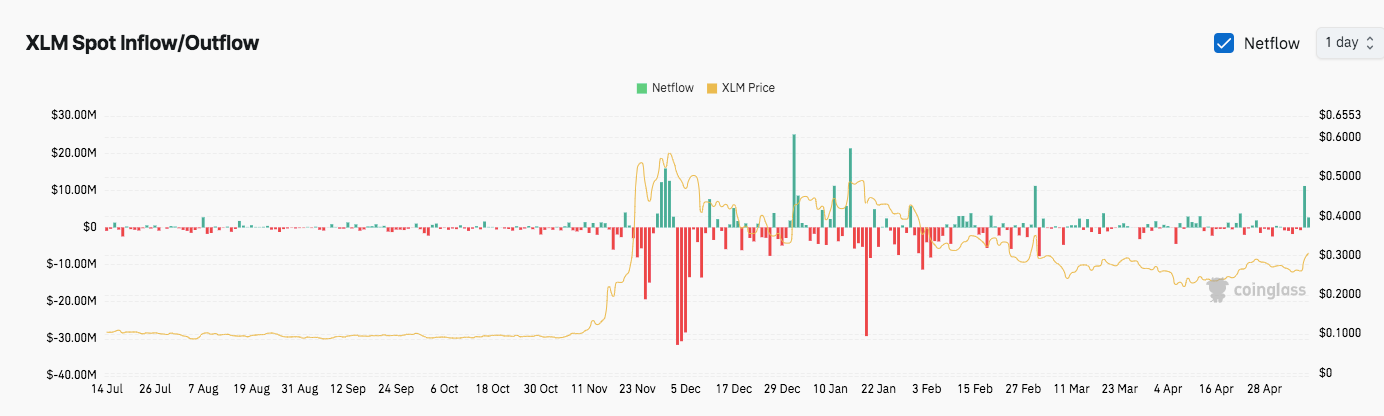 Source: Coinglass
Since February, netflows have remained negative, pointing to steady selling pressure. Nonetheless, recent inflow spikes near the $0.38 mark could indicate renewed accumulation. This behavior often precedes sustained upward moves.
Momentum Indicators Favor Bulls
 XLM/USD daily price chart, Source: TradingView
Technical indicators are reinforcing the bullish case. The MACD line has crossed above the signal line, with a growing positive histogram. This reflects rising momentum.
Related: Stellar (XLM) Price Prediction 2025-2030: Will XLM Price Hit $1.5 Soon?
Additionally, the RSI stands at 67.55 just below the overbought level of 70. While momentum is clearly strong, any push above 70 warrants caution, as it could signal a near-term pullback.
Disclaimer: The information presented in this article is for informational and educational purposes only. The article does not constitute financial advice or advice of any kind. Coin Edition is not responsible for any losses incurred as a result of the utilization of content, products, or services mentioned. Readers are advised to exercise caution before taking any action related to the company.