Bitget App
Trade smarter
Buy cryptoMarketsTradeFuturesEarnWeb3SquareMore
Trade
Spot
Buy and sell crypto with ease
Margin
Amplify your capital and maximize fund efficiency
Onchain
Going Onchain, without going Onchain!
Convert & block trade
Convert crypto with one click and zero fees
Explore
Launchhub
Gain the edge early and start winning
Copy
Copy elite trader with one click
Bots
Simple, fast, and reliable AI trading bot
Trade
USDT-M Futures
Futures settled in USDT
USDC-M Futures
Futures settled in USDC
Coin-M Futures
Futures settled in cryptocurrencies
Explore
Futures guide
A beginner-to-advanced journey in futures trading
Futures promotions
Generous rewards await
Overview
A variety of products to grow your assets
Simple Earn
Deposit and withdraw anytime to earn flexible returns with zero risk
On-chain Earn
Earn profits daily without risking principal
Structured Earn
Robust financial innovation to navigate market swings
VIP and Wealth Management
Premium services for smart wealth management
Loans
Flexible borrowing with high fund security
RAY Rallies After Key Breakout and Retest — Can PEPE Follow the Same Fractal?

RAY Rallies After Key Breakout and Retest — Can PEPE Follow the Same Fractal?

CoinsProbeCoinsProbe2025/04/29 00:00
By:Nilesh Hembade

Date: Mon, April 28, 2025 | 06:55 PM GMT

In the cryptocurrency market over the past three weeks, major tokens are starting to show signs of recovery after enduring sharp corrections since the start of the year. Among them, Raydium (RAY) has come into the spotlight with an impressive weekly gain of 29%, fueled by a major technical breakout and retest on the daily timeframe.

Meanwhile, Pepe (PEPE) is also back on the green track with a 13% surge and is flashing a very similar setup to RAY’s recent breakout, suggesting that a short-term rally could be just around the corner.

RAY Rallies After Key Breakout and Retest — Can PEPE Follow the Same Fractal? image 0 
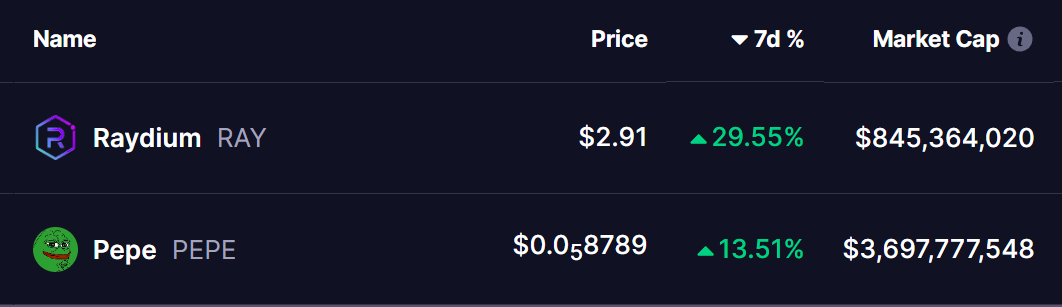
Source: Coinmarketcap

RAY and PEPE Fractal Analysis

As shown on the left side of the chart, Raydium (RAY) recently broke out of a classic double bottom structure, piercing through its neckline around the $2.16 level. After a clean retest of the breakout zone, RAY kickstarted a strong rally, delivering about 45% gains from the breakout point.

Now, if we look at the right side of the chart, Pepe (PEPE) seems to be following almost the exact same pattern. PEPE has broken out from its double bottom neckline at approximately $0.0000092 and is currently in the process of retesting this level — very similar to what RAY did before its big move upward.

If PEPE continues to mirror RAY’s recent fractal, we could see it rally toward the $0.000014 zone — representing a potential 60% upside from its current price.

What’s Ahead?

Adding even more strength to the fractal similarity, the 50-day Moving Average and MACD indicators on both charts are also aligning.

  • For RAY, the breakout was supported by a bullish MACD crossover and a price reclaim above the 50D MA.
  • PEPE is now showing a very similar MACD bullish crossover, and its price is hovering just above the 50D MA as well.

If momentum holds, PEPE could be setting up for a strong rally in the coming days or weeks, with the key breakout and retest.

Disclaimer: This article is for informational purposes only and does not constitute financial advice. Always do your own research before making investment decisions in cryptocurrencies.

 
0

Disclaimer: The content of this article solely reflects the author's opinion and does not represent the platform in any capacity. This article is not intended to serve as a reference for making investment decisions.

PoolX: Earn new token airdrops
Lock your assets and earn 10%+ APR
Lock now!

You may also like

Macroeconomic Interpretation: Powell's "Driving in the Fog" and the Financial "Hunger Games"

The article discusses the uncertainty in the global economy under the Federal Reserve's policies, particularly Powell's "hawkish rate cuts" and their impact on the market. It analyzes market distortions driven by liquidity, the capital expenditure risks of the AI investment boom, and the loss of trust caused by policy centralization. Finally, the article provides updates on macroeconomic indicators and market trends. Summary generated by Mars AI. This summary is generated by the Mars AI model, and the accuracy and completeness of its content are still in the process of iterative improvement.

MarsBit2025/11/09 06:06
Macroeconomic Interpretation: Powell's "Driving in the Fog" and the Financial "Hunger Games"