

Date: Fri, April 04, 2025 | 03:44 PM GMT
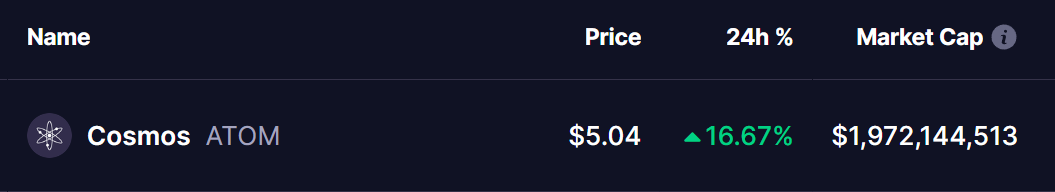
In today’s cryptocurrency market, Bitcoin (BTC) and Ethereum (ETH) remain in the green, despite ongoing tariff wars impacting global markets. While most assets are showing mixed performance, Cosmos (ATOM) is emerging as one of the strongest gainers, surging by 16%.
Beyond its recent price increase, the technical setup on ATOM’s 4-hour chart suggests that the token might be on the verge of a significant breakout.
 Source: Coinmarketcap
Inverse Head and Shoulders Pattern Signals Bullish Potential
ATOM’s price action over the past several weeks has formed a clear inverse head and shoulders pattern, a widely recognized bullish reversal formation. This setup consists of three dips—two smaller troughs on either side and a deeper central low, resembling an inverted head and shoulders.
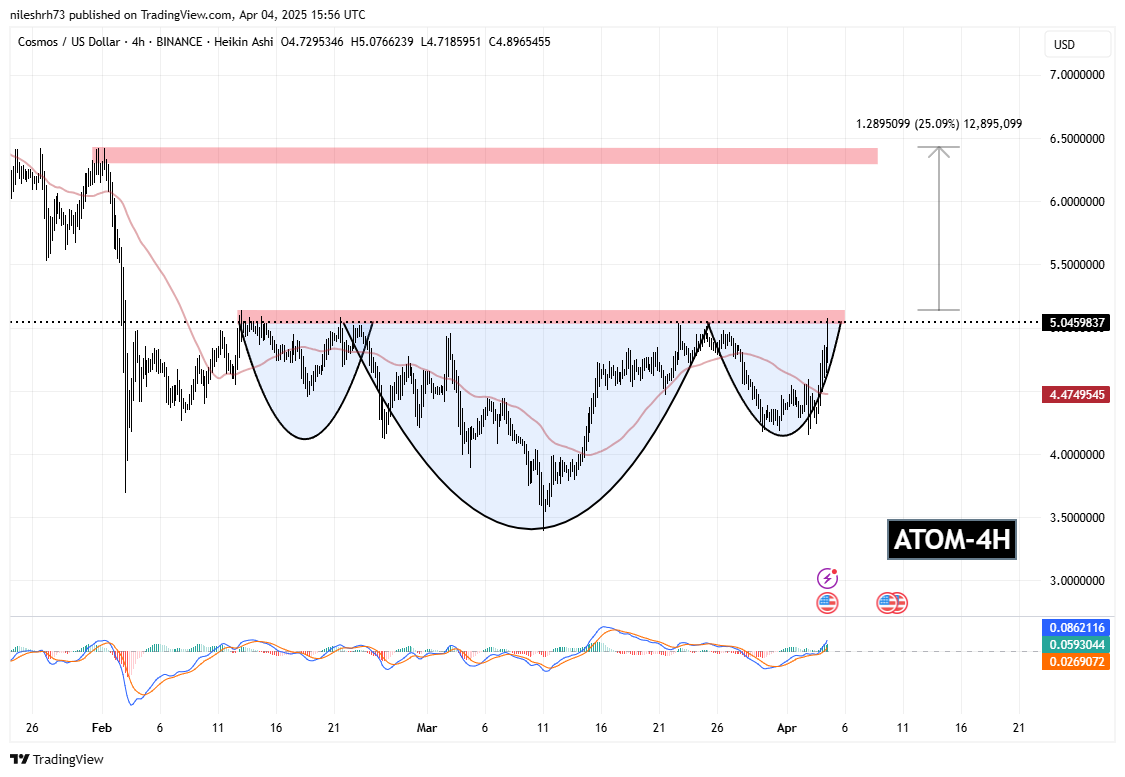 Cosmos (ATOM) 4H Chart/Coinsprobe (Source: Tradingview)
The neckline resistance, marked at $5.04, has been tested multiple times in the last month but has yet to be decisively broken. A breakout above this level could trigger a significant upward move, as historical price action suggests that once this formation completes, strong rallies tend to follow.
Adding to the bullish case, the MACD indicator has flipped positive, showing a bullish crossover. This suggests growing momentum, increasing the likelihood of a breakout in the coming sessions.
What’s Ahead for ATOM?
If ATOM successfully breaks above this neckline resistance level ($5.14), the measured move from the inverse head and shoulders pattern suggests a potential price target of $6.42. This would represent a 25% gain from the breakout point.
However, if the resistance holds, ATOM could see a short-term pullback toward $4.90 before making another attempt to break out.
Disclaimer: This article is for informational purposes only and not financial advice. Always conduct your own research before investing in cryptocurrencies.