Solana’s 12% Surge Faces Key Technical Headwinds: What You Need to Know

Solana's 12% surge may not be as strong as it seems, as technical indicators show weakening buying support and bearish sentiment among traders. The coin faces a critical moment, with its price potentially dropping to $130.82 if key support fails.
Solana has surged by 12% over the past week, riding the broader market’s recovery attempt. At press time, the Layer-1 (L1) trades at $139.41.
However, a key technical indicator has flashed a bearish divergence, raising doubts about the strength of this uptrend. This analysis holds the details.
Solana’s Rally Faces Headwinds as Bearish Divergence Emerges
An assessment of the SOL/USD one-day chart reveals that while SOL’s price has climbed in the past seven days, its Chaikin Money Flow (CMF) has declined, forming a bearish divergence.
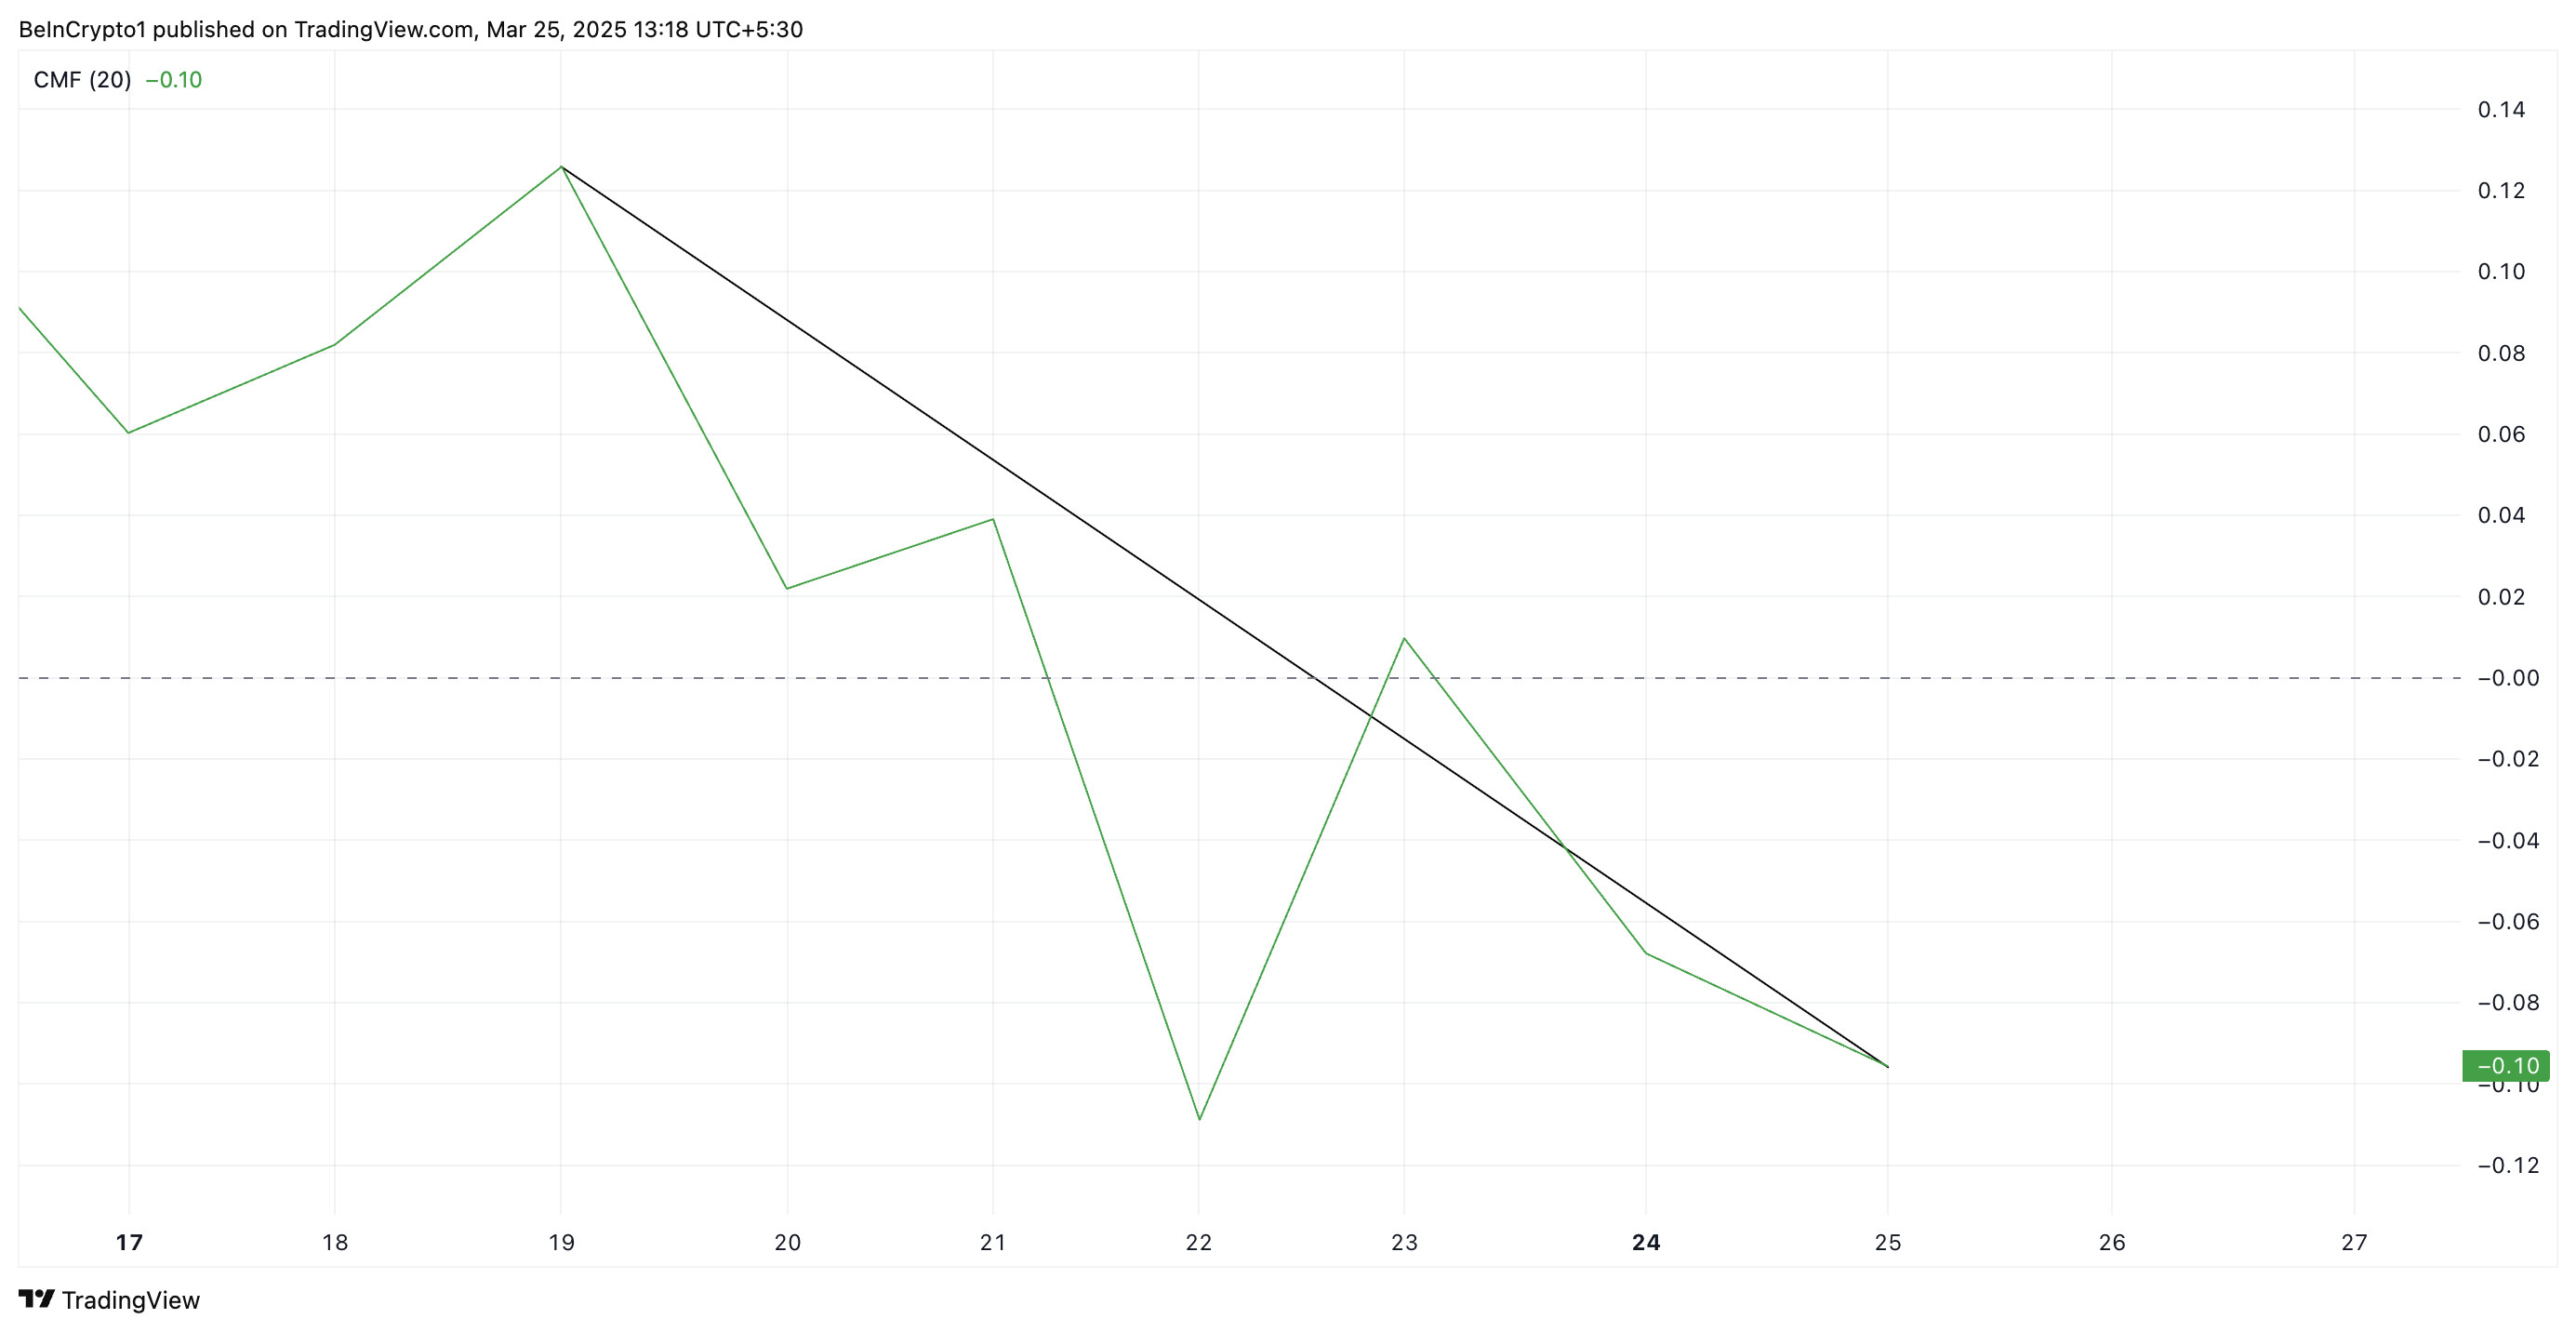 SOL CMF. Source:
TradingView
SOL CMF. Source:
TradingView
The CMF indicator measures the strength of buying and selling pressure by analyzing volume and price movements over a specific period. It ranges between -1 and +1, with positive values indicating strong buying pressure and negative values signaling selling dominance.
A bearish divergence occurs when the price of an asset is rising, but the CMF is falling, suggesting that the rally lacks strong buying support. This means that despite SOL’s higher prices, capital inflows are weakening, hinting at a potential reversal or slowdown in the coin’s uptrend.
Solana’s long/short ratio further supports this bearish outlook. At press time, it rests at 0.97, reflecting a high demand for short positions among derivatives traders.
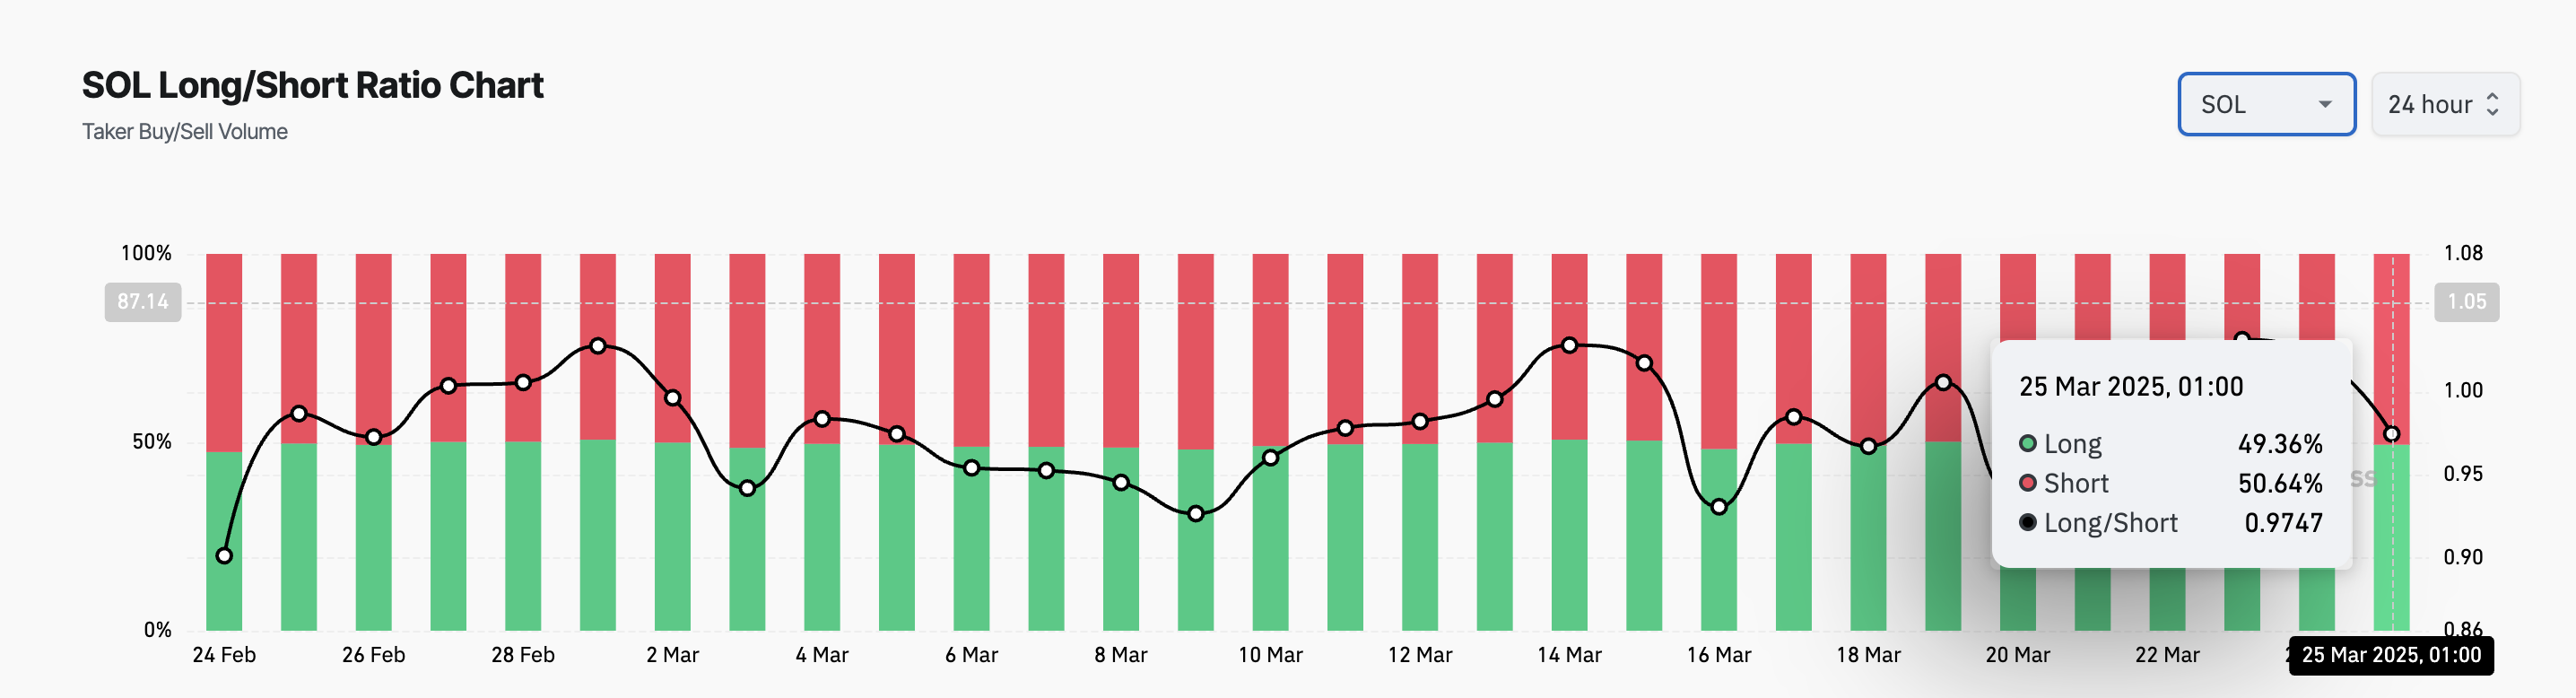 SOL Long/Short Ratio. Source:
Coinglass
SOL Long/Short Ratio. Source:
Coinglass
The long/short ratio measures the proportion of long positions (bets on price increases) to short positions (bets on price declines) in the market. A ratio below one like this means there are more short positions than long ones. This indicates that traders are bearish on SOL and are betting in favor of short-term price dips
Solana Faces Pivotal Moment as Bulls and Bears Battle
As of this writing, SOL trades at $139.41, resting above support formed at $136.92. Once buying pressure wanes and SOL sellers consolidate their dominance, the coin’s price could attempt to test this support level.
Should the price zone fail to hold, downward pressure on SOL would intensify, potentially driving its price down to $130.82.
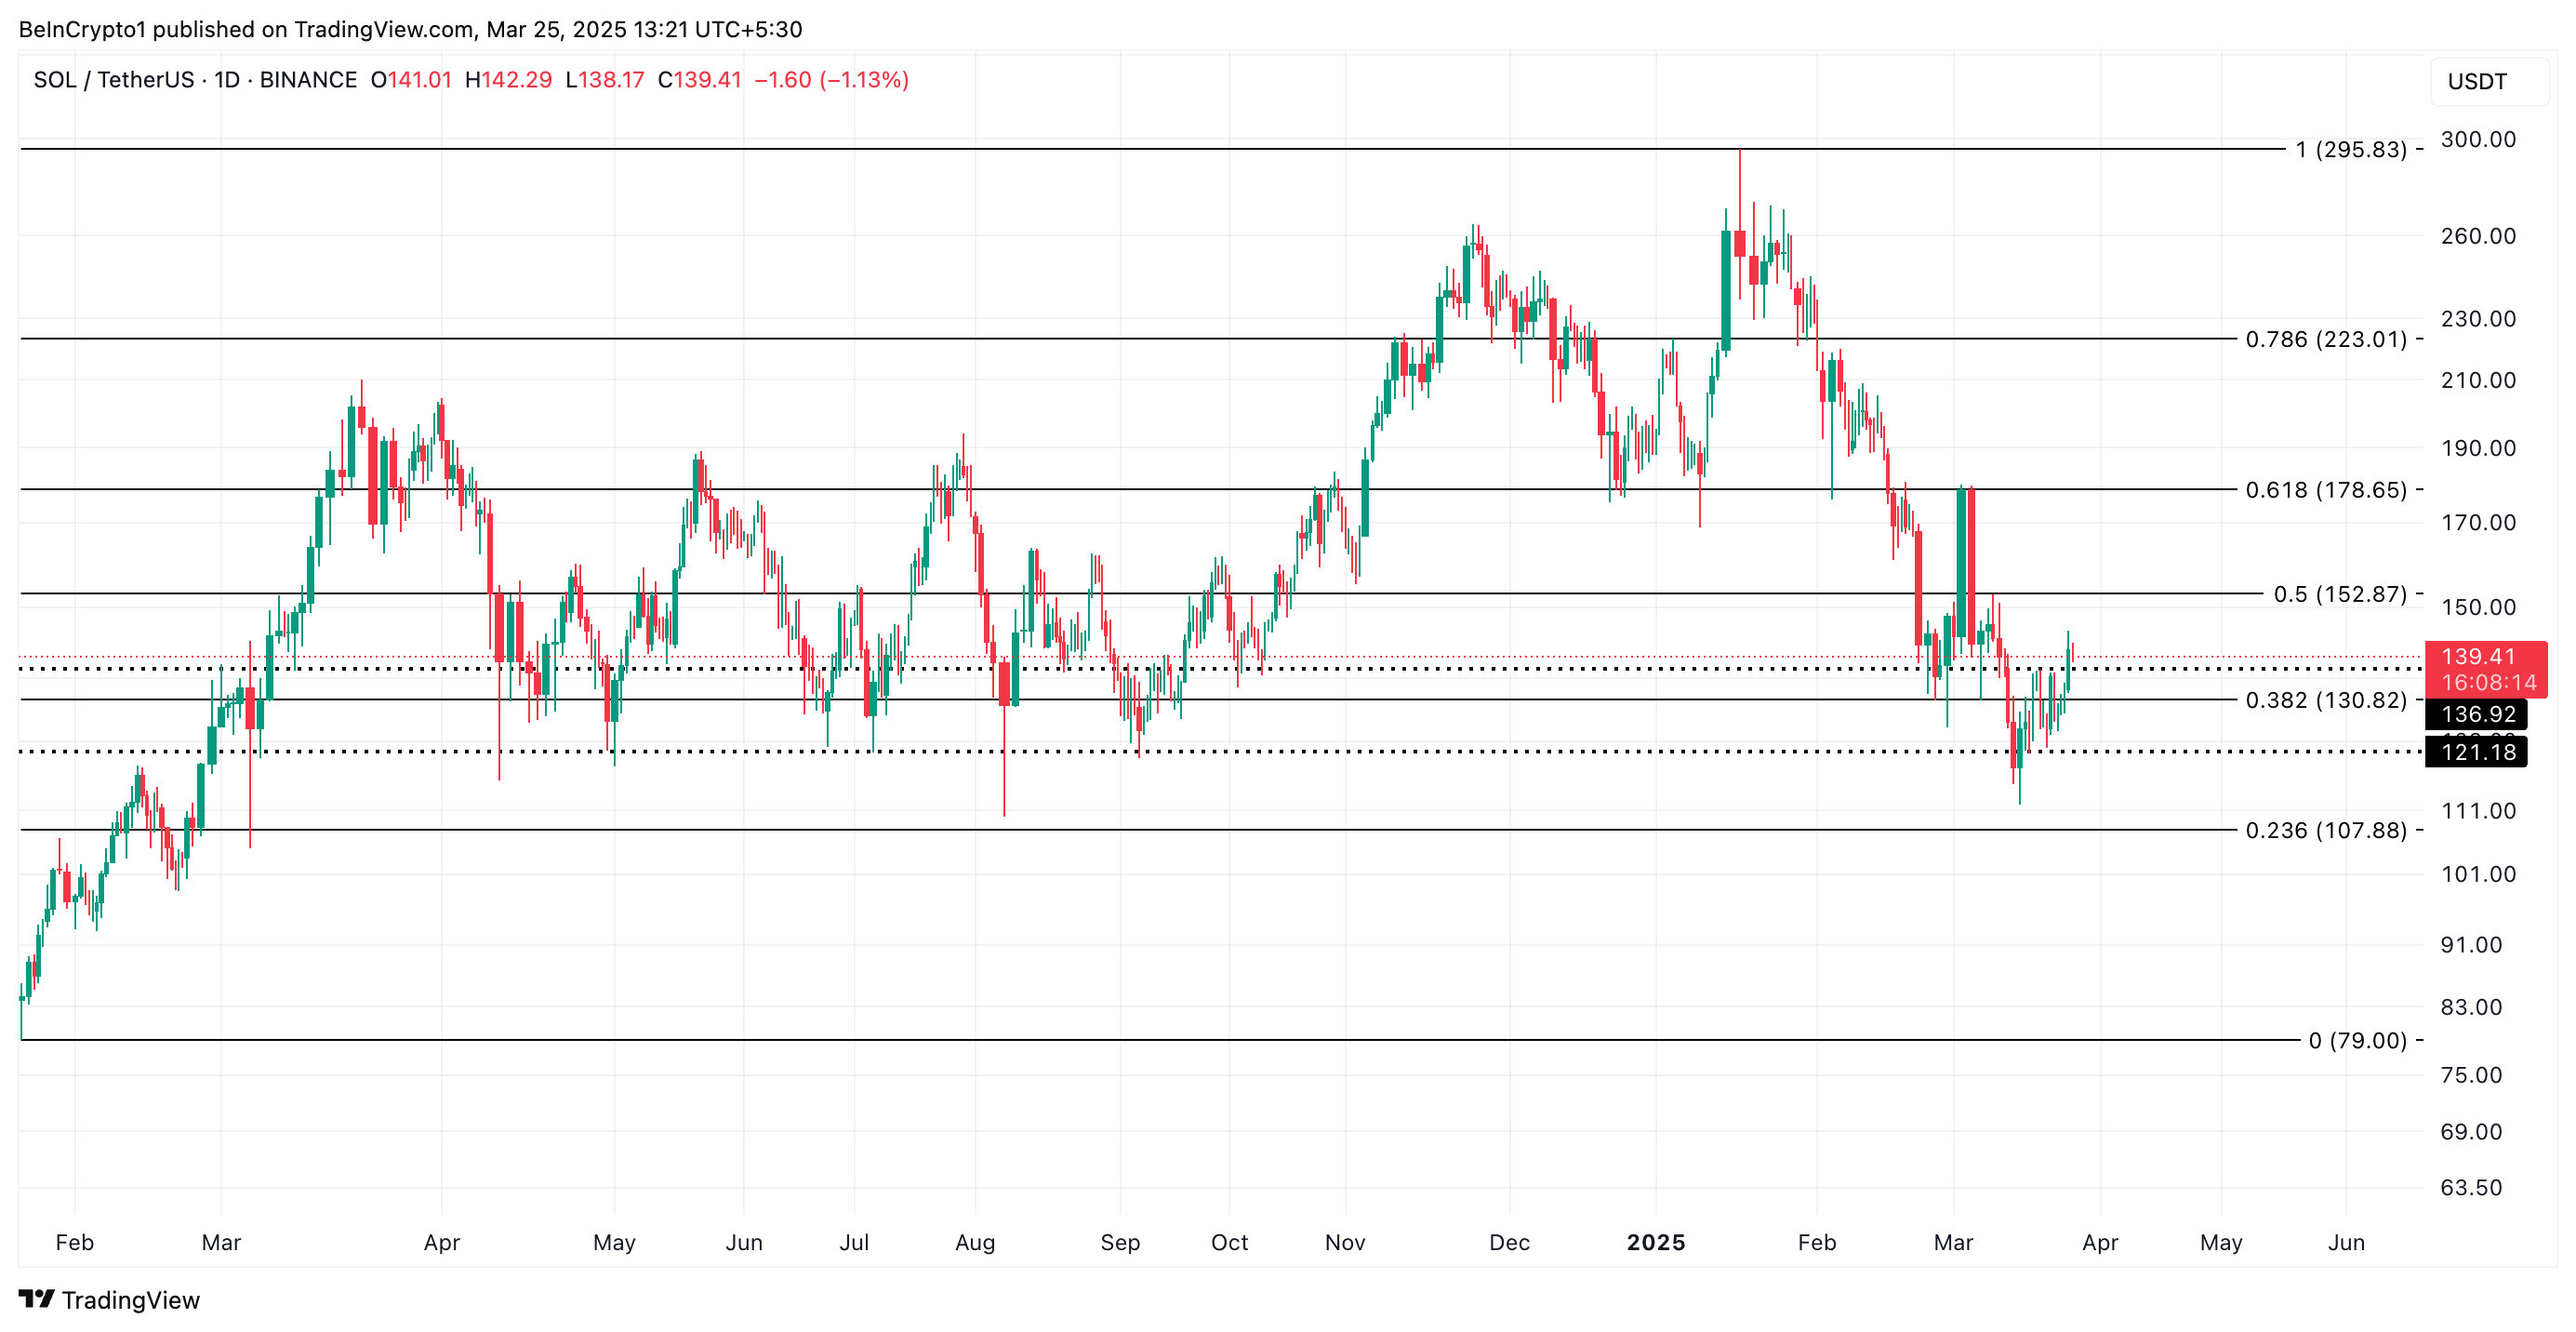 SOL Price Analysis. Source:
TradingView
SOL Price Analysis. Source:
TradingView
Conversely, a resurgence in actual demand for SOL would invalidate this bearish outlook. In that case, the coin’s price could rise to $152.87.
Disclaimer: The content of this article solely reflects the author's opinion and does not represent the platform in any capacity. This article is not intended to serve as a reference for making investment decisions.
You may also like
Interview with VanEck Investment Manager: From an Institutional Perspective, Should You Buy BTC Now?
The support levels near $78,000 and $70,000 present a good entry opportunity.

Macroeconomic Report: How Trump, the Federal Reserve, and Trade Sparked the Biggest Market Volatility in History
The deliberate devaluation of the US dollar, combined with extreme cross-border imbalances and excessive valuations, is brewing a volatility event.
Vitalik donated 256 ETH to two chat apps you've never heard of—what exactly is he betting on?
He made it clear: neither of these two applications is perfect, and there is still a long way to go to achieve true user experience and security.
Prediction Market Supercycle