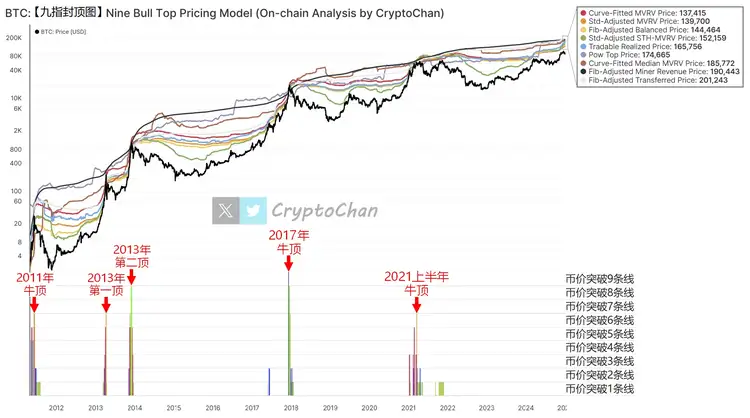
Bitcoin chain indicator analysis: the nine-finger cap chart suggests that the bull market is still accumulating strength
- 2011 bull market peak: Bitcoin price breaks through 6 reference lines.
- The first peak in 2013: Bitcoin price broke through six reference lines.
- The second peak in 2013: Bitcoin price broke through 8 reference lines.
- 2017 bull market peak: Bitcoin price breaks through 9 reference lines, reaching the chart limit.
- The bull market peak in the first half of 2021: Bitcoin price broke through 6 reference lines again.
- 🔴 Curve-Fitted MVRV Price: $137,415
- 🟠 Std-Adjusted MVRV Price: $139,700
- 🟡 Fib-Adjusted Balanced Price: $144,464
- 🟢 Std-Adjusted STH-MVRV Price: $152,159
- 🔵 Tradable Realized Price: $165,756
- 🟣 Pow Top Price: $174,665
- 🟤 Curve-Fitted Median MVRV Price: $185,772
- ⚫ Fib-Adjusted Miner Revenue Price: $190,443
- ⚪️ Fib-Adjusted Transferred Price: $201,243
Disclaimer: The content of this article solely reflects the author's opinion and does not represent the platform in any capacity. This article is not intended to serve as a reference for making investment decisions.
You may also like
Ethereum faces tough path to $3.9K as sentiment and demand fizzle

Can Bitcoin bulls avoid the cycle’s fourth ‘death cross’ at $102K?

Technical Traceability Analysis Report on the LuBian Mining Pool Hacked and Massive Bitcoin Theft Incident
The US government may have already used hacking techniques as early as 2020 to steal 127,000 bitcoins owned by Chen Zhi. This is a typical "black eats black" incident orchestrated by a state-level hacker organization. This report takes a technical perspective, conducting technical tracing to deeply analyze the key technical details of the incident, focusing on the ins and outs of the theft of this batch of bitcoins, reconstructing the complete attack timeline, and evaluating the security mechanisms of bitcoin. The aim is to provide valuable security insights for the cryptocurrency industry and its users.