

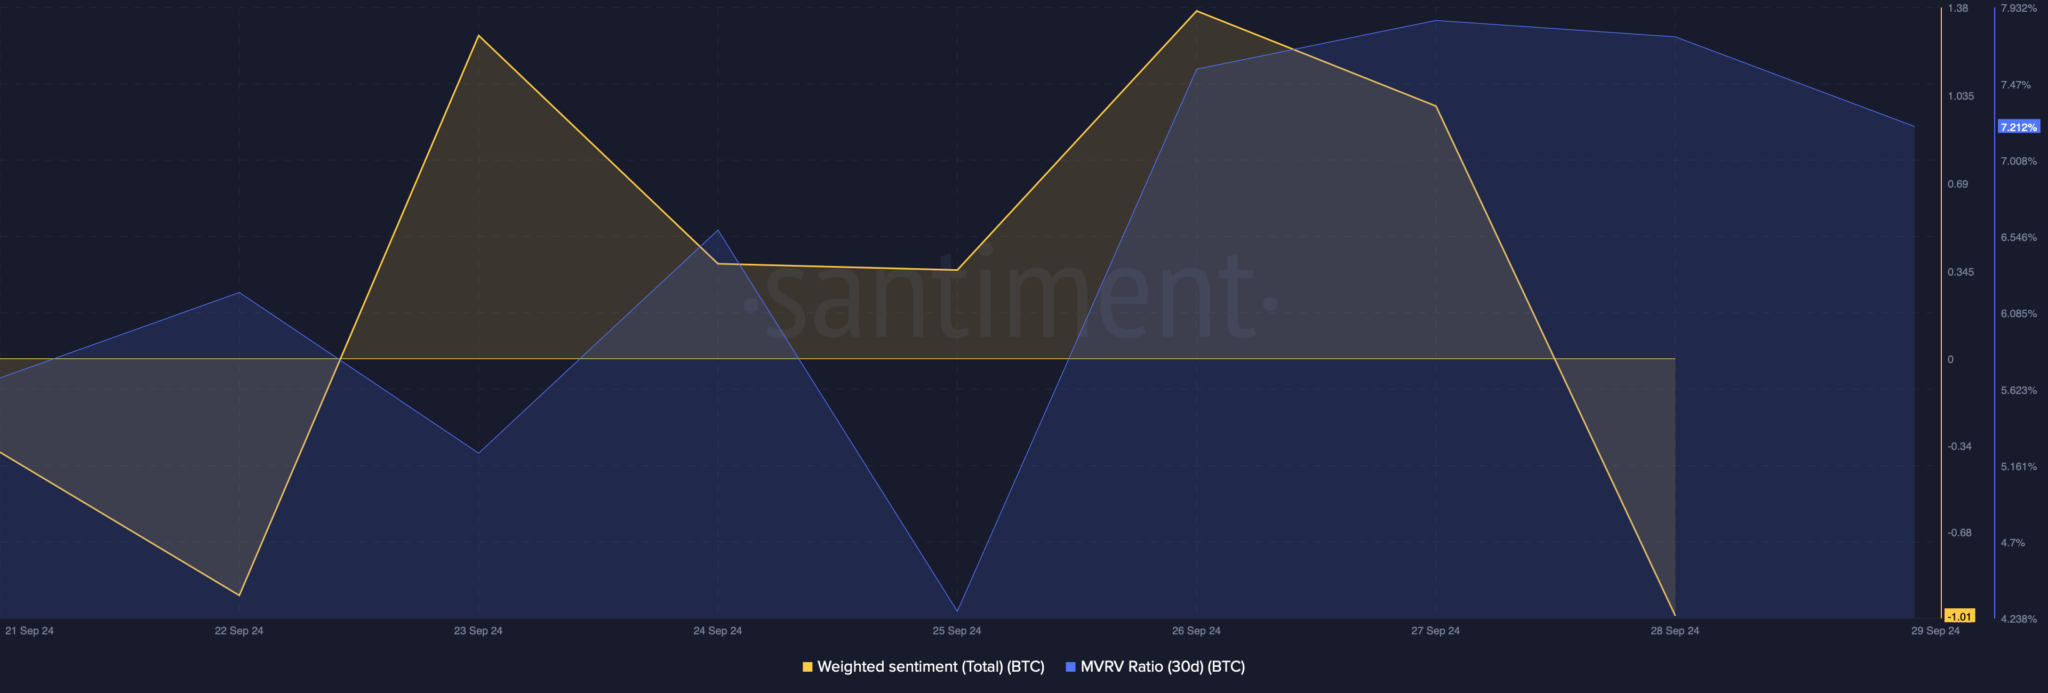
- On-chain data from Santiment indicates a slight drop in Bitcoin’s MVRV ratio, suggesting bearish market sentiment.
- Despite bearish trends, the fear and greed index at 38% suggests potential for an upcoming price rally.
Bitcoin recently surpassed the $66,000 mark, generating significant attention within the cryptocurrency community. However, this upward trend was short-lived as the price dipped below this threshold again. Current data indicates that Bitcoin may be on the cusp of a major price correction.
In the last 24 hours, Bitcoin has undergone a price correction, falling under $66,000. As of this report, Bitcoin is trading at $65,504.34. ETHNews had previously indicated the likelihood of Bitcoin experiencing a price correction.
 Source: Crypto Bullet
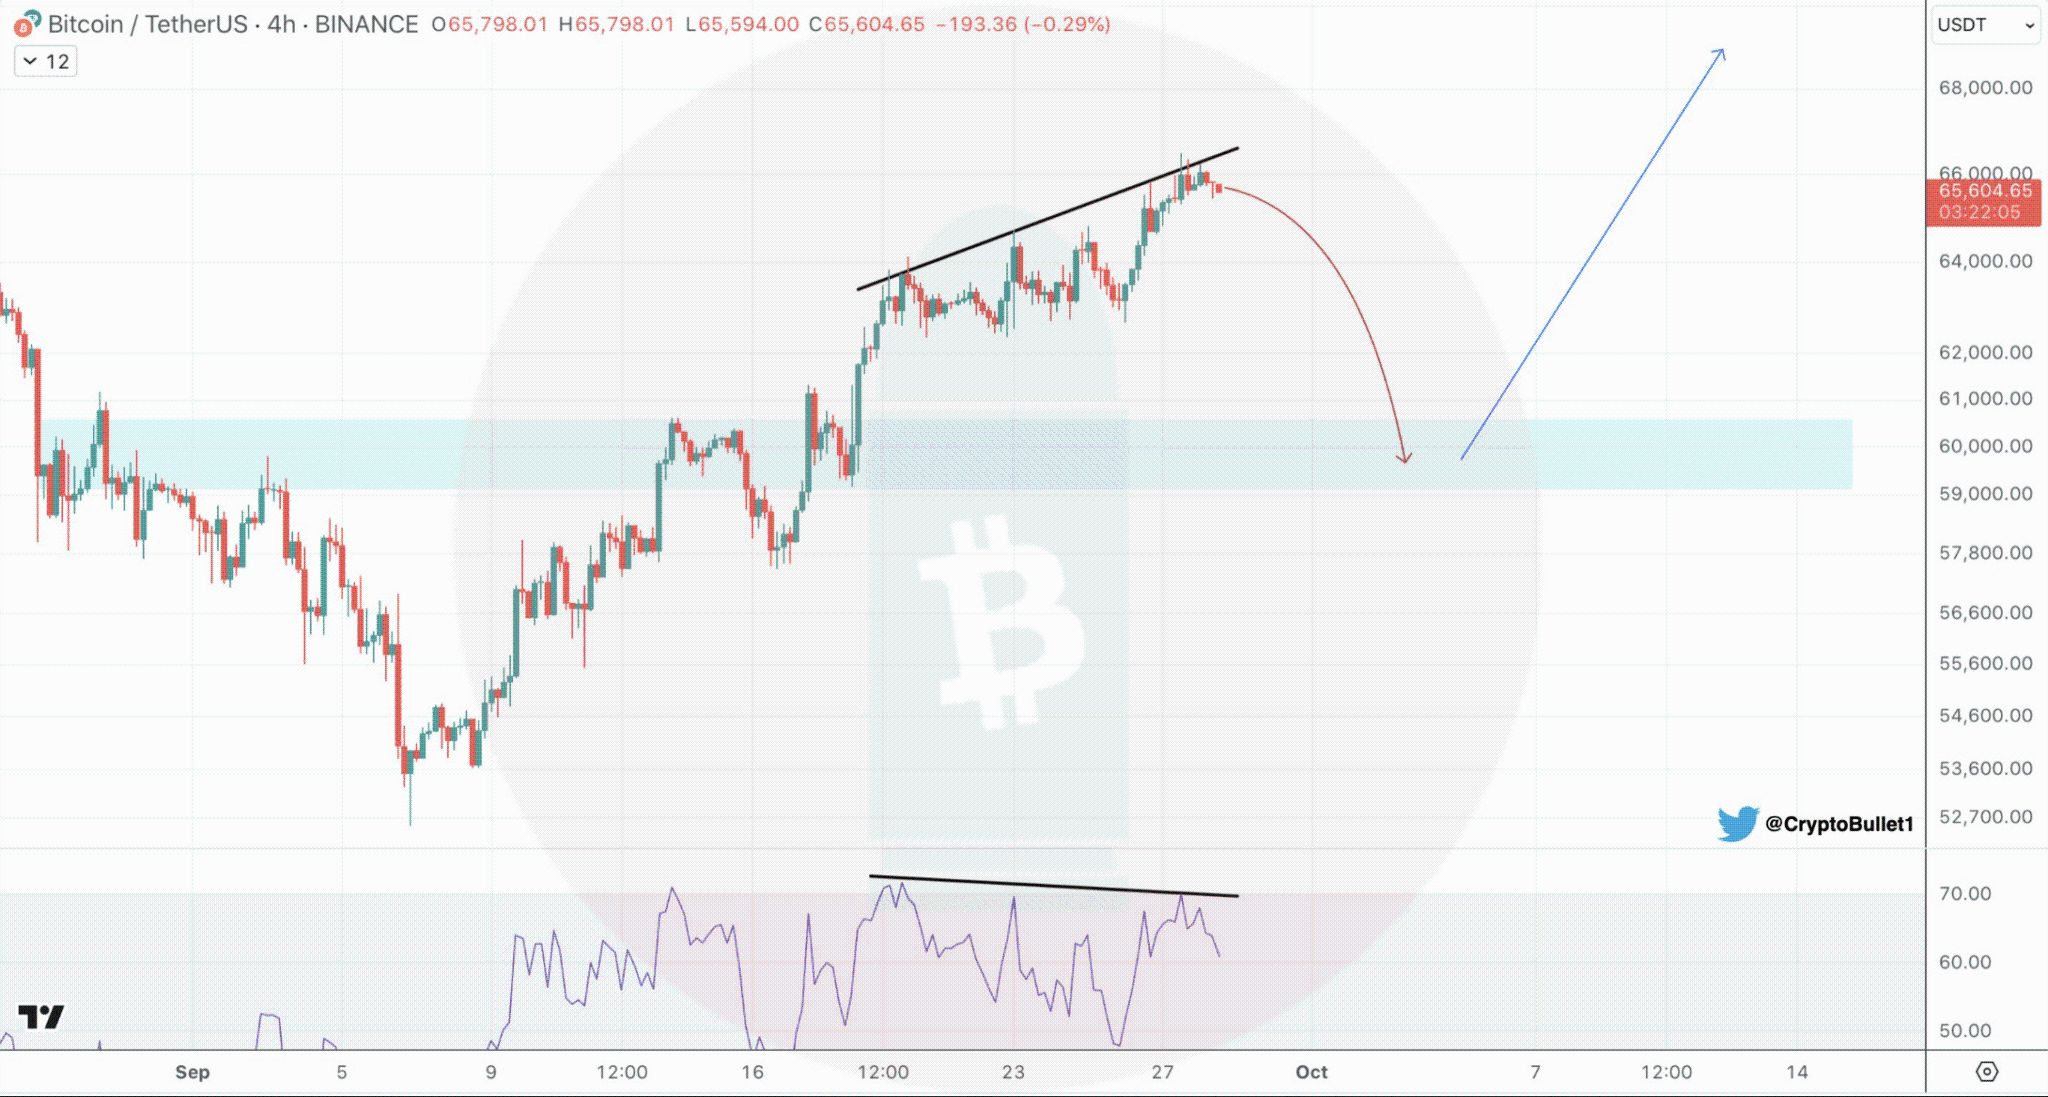
A recent tweet from Crypto Bullet pointed out a bearish divergence on Bitcoin’s 4-hour chart, a classic indicator that often precedes a price drop.
#BTC 4h chart
I think we can get a correction to $59-60k and then continue to rally 📈
That dip would be a great opportunity to buy $Alts if you are still sidelined pic.twitter.com/IoAdvNHrS1
— CryptoBullet (@CryptoBullet1) September 28, 2024
A bearish divergence occurs when price achieves new highs while an oscillator fails to reach a new peak. This divergence suggests that momentum is waning, increasing the likelihood of a price correction. In this scenario, there is a possibility that Bitcoin could retreat to $60,000 if the bearish trend continues.
 Source: Santiment
Further analysis from Santiment’s on-chain data supports the bearish outlook, as the MVRV ratio—a measure of market value to realized value—has slightly declined in recent days. This decline is typically interpreted as a bearish signal, implying a potential decrease in Bitcoin’s price.
Additionally, the weighted sentiment around Bitcoin has also turned bearish, further suggesting a potential decline.
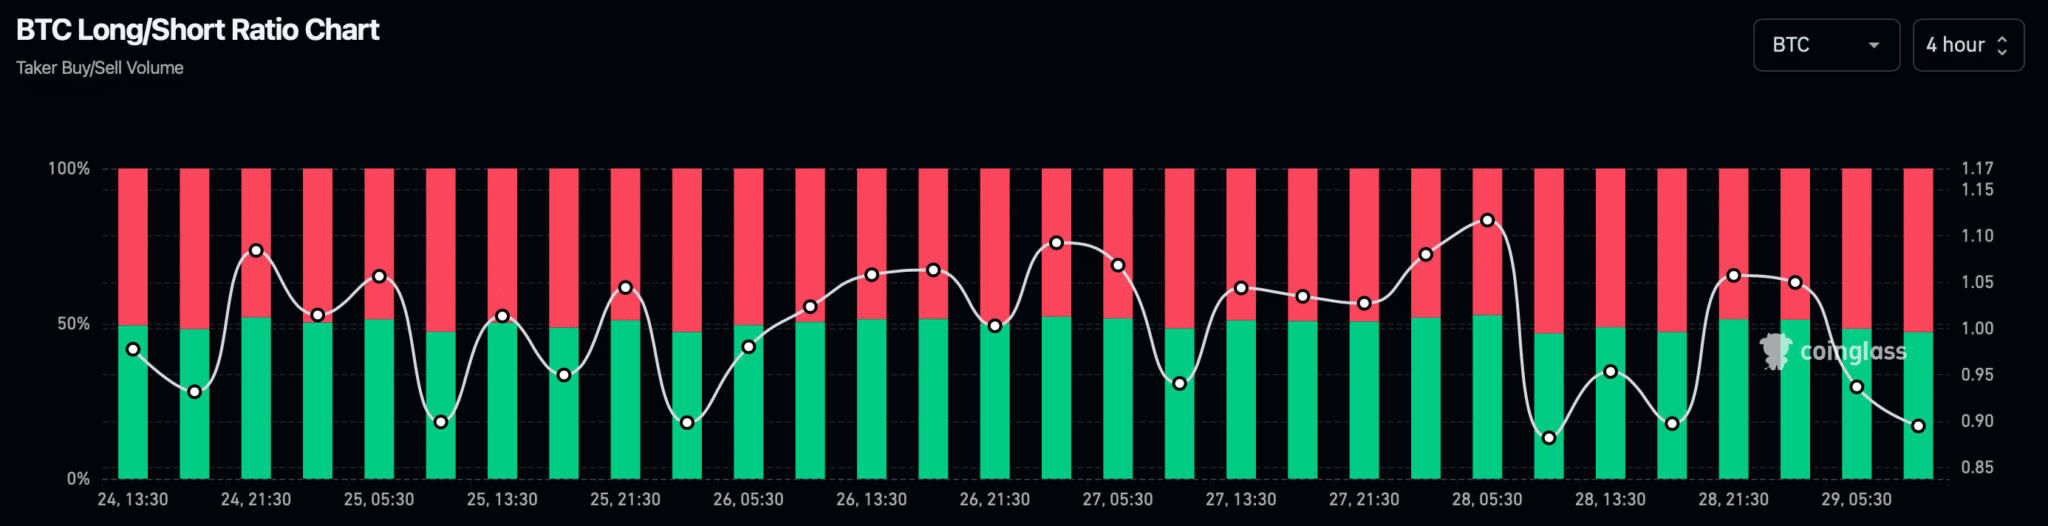
ETHNews review of Coinglass’ data revealed another bearish indicator, noting that Bitcoin’s long/short ratio has fallen. This change indicates an increase in short positions relative to long positions, further suggesting that market sentiment is leaning toward a bearish phase.
 Source: Coinglass
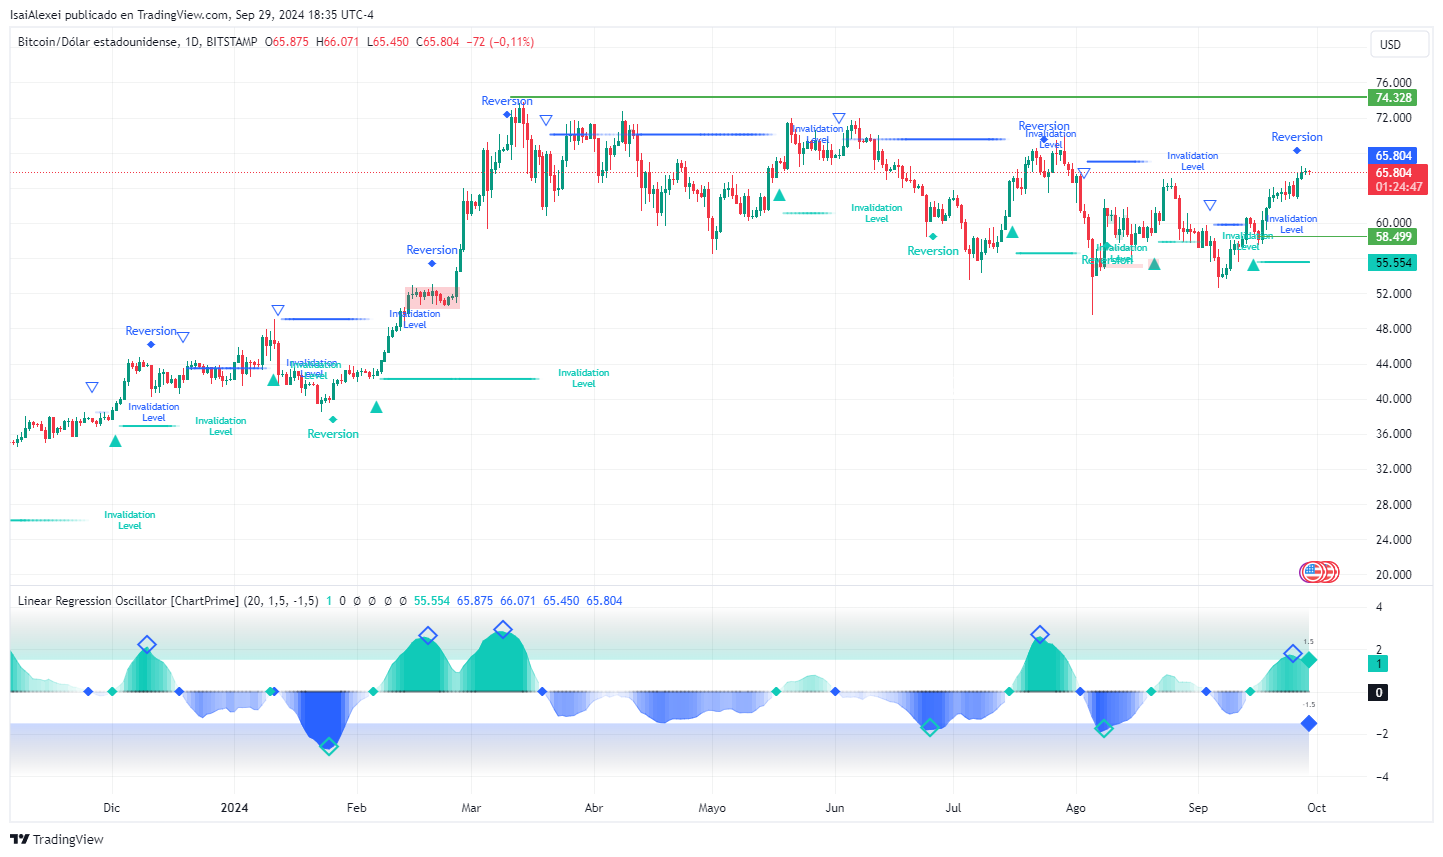
Despite these bearish indicators, not all signals predict a downturn. The fear and greed index currently stands at 38%, placing the market in a “fear” phase. This sentiment can often precede a market rally, as contrarian investors might see it as an opportune moment to buy.
Moreover, on the daily chart, the 9-day moving average remains above the 21-day moving average, which could indicate underlying bullish momentum.
 Source: Tradingview
If the bullish signals hold, Bitcoin’s price might aim for the $68,000 mark before any potential fallback to $60,000. This interplay of bearish and bullish indicators illustrates the current volatility and unpredictability of the Bitcoin market , requiring investors to stay particularly vigilant.