Bitcoin Price Eyes Recovery But Can BTC Bulls Regain Strength?
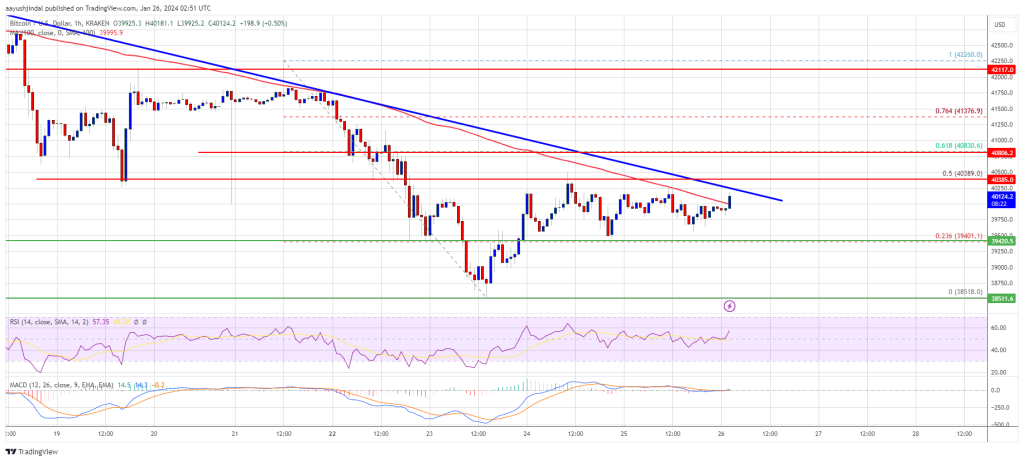
Bitcoin price is aiming for an upside break above the $40,500 resistance. BTC bulls could face heavy resistance near $40,850 and $41,350.
- Bitcoin price is attempting a recovery wave from the $38,500 support zone.
- The price is trading just above $40,000 and the 100 hourly Simple moving average.
- There is a crucial bearish trend line forming with resistance near $40,250 on the hourly chart of the BTC/USD pair (data feed from Kraken).
- The pair could struggle to settle above the $40,400 and $40,500 resistance levels.
Bitcoin Price Eyes Upside Break
Bitcoin price remained well-bid above the $38,500 support zone . BTC formed a base and recently started a consolidation phase above the $39,000 level.
The price was able to recover above the 23.6% Fib retracement level of the downward move from the $42,261 swing high to the $38,518 low. The bulls seem to be active above the $39,200 and $39,350 levels. Bitcoin is now trading just above $40,000 and the 100 hourly Simple moving average.
However, there are many hurdles near $40,400. Immediate resistance is near the $40,250 level. There is also a crucial bearish trend line forming with resistance near $40,250 on the hourly chart of the BTC/USD pair.
The next key resistance could be $40,380 or the 50% Fib retracement level of the downward move from the $42,261 swing high to the $38,518 low, above which the price could rise and test $40,850. A clear move above the $40,850 resistance could send the price toward the $41,250 resistance.
Source: BTCUSD on TradingView.com
The next resistance is now forming near the $42,000 level. A close above the $42,000 level could push the price further higher. The next major resistance sits at $42,500.
Another Failure In BTC?
If Bitcoin fails to rise above the $40,380 resistance zone, it could start another decline. Immediate support on the downside is near the $39,420 level.
The next major support is $38,500. If there is a close below $38,500, the price could gain bearish momentum. In the stated case, the price could dive toward the $37,000 support in the near term.
Technical indicators:
Hourly MACD – The MACD is now losing pace in the bearish zone.
Hourly RSI (Relative Strength Index) – The RSI for BTC/USD is now above the 50 level.
Major Support Levels – $39,420, followed by $38,500.
Major Resistance Levels – $40,250, $40,400, and $40,850.
Disclaimer: The content of this article solely reflects the author's opinion and does not represent the platform in any capacity. This article is not intended to serve as a reference for making investment decisions.
You may also like
Crypto Markets Face a Rollercoaster: What Happened in the Past 24 Hours?
In Brief Bitcoin price dropped by 2.4%, influencing overall crypto market sentiment. The top 10 cryptocurrencies saw a general decline over the past 24 hours. Market seeks stability amid cautious investor behavior and potential short-term volatility.