
Ethereum Price Dips Alongside Bitcoin, Decoding Key Hurdles To Fresh Increase
Ethereum price struggled to rise above $2,550 and $2,580. ETH started a fresh decline like Bitcoin and traded below the $2,500 support zone.
- Ethereum attempted a fresh increase but failed to surpass $2,550.
- The price is trading below $2,500 and the 100-hourly Simple Moving Average.
- There is a connecting bearish trend line forming with resistance near $2,480 on the hourly chart of ETH/USD (data feed via Kraken).
- The pair continue to move down if there is a move below the $2,425 support.
Ethereum Price Extends Decline
Ethereum price struggled to gain pace for a move above the $2,550 and $2,580 resistance levels. ETH formed a short-term top and started a fresh decline below $2,500 like Bitcoin .
There was a move below the $2,450 level. A new weekly low was formed near $2,424 and the price is now consolidating losses . There was a minor increase above the $2,450 level, but the bears were active near the 23.6% Fib retracement level of the downward move from the $2,614 swing high to the $2,424 low.
Ethereum is now trading below $2,500 and the 100-hourly Simple Moving Average. On the upside, the price is facing resistance near the $2,465 level. The next hurdle could be $2,480. There is also a connecting bearish trend line forming with resistance near $2,480 on the hourly chart of ETH/USD.
The next major resistance is now near $2,520. A clear move above the $2,520 level might start a decent increase. In the stated case, the price could rise toward the $2,580 level.
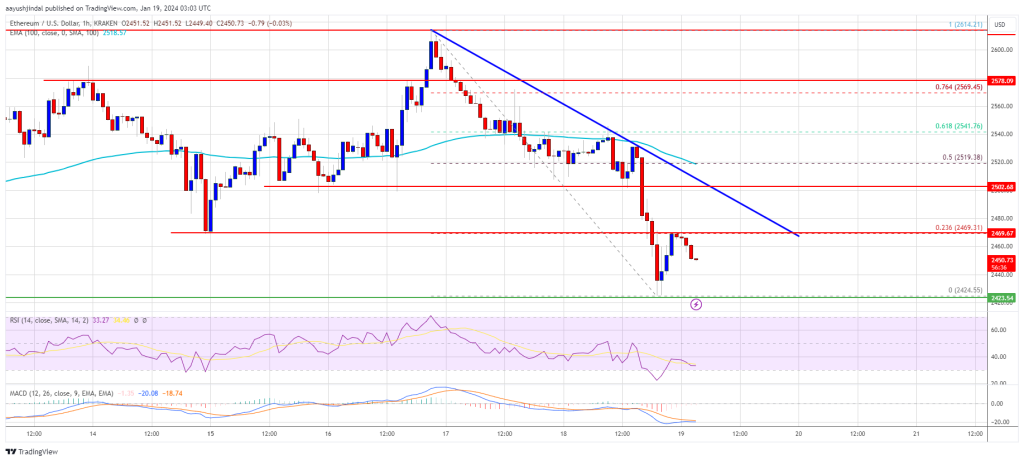
Source: ETHUSD on TradingView.com
The next key hurdle sits near the $2,620 zone. A close above the $2,620 resistance could start another steady increase. The next key resistance is near $2,680. Any more gains might send the price toward the $2,720 zone.
More Losses in ETH?
If Ethereum fails to clear the $2,520 resistance, it could start another decline. Initial support on the downside is near the $2,440 level.
The next key support could be the $2,425 zone. A downside break below the $2,425 support might send the price further lower. In the stated case, Ether could test the $2,350 support. Any more losses might send the price toward the $2,320 level.
Technical Indicators
Hourly MACD – The MACD for ETH/USD is gaining momentum in the bearish zone.
Hourly RSI – The RSI for ETH/USD is now below the 50 level.
Major Support Level – $2,425
Major Resistance Level – $2,520
Disclaimer: The content of this article solely reflects the author's opinion and does not represent the platform in any capacity. This article is not intended to serve as a reference for making investment decisions.
You may also like
Ethereum Consensus Layer Reconstruction Beam Chain: The Ultimate Path or a Technical Maze?
Is the 5-year implementation timeline for Beam Chain reasonable? What does the community think?

![[Bitpush Daily News Highlights] Goldman Sachs: Stock sell-off expected to reach $40 billion next week; Jefferies report: Tether's gold reserves reach 116 tons, making it one of the world's largest non-sovereign gold holders; TechCrunch: Prediction market Kalshi raises $1 billion, valuation reaches $11 billion](https://img.bgstatic.com/multiLang/image/social/266a4eb2f52d42906f0b432a905d6ba81763665562274.png)
November 21 Key Market Information Gap, A Must-See! | Alpha Morning Report
1. Top News: Base Co-founder Jesse's jesse Token Released, Currently Valued at $14 Million 2. Token Unlock: $DMC, $ID

Bitcoin slump to $86K brings BTC closer to ‘max pain’ but great ‘discount’ zone

Trending news
MoreEthereum Consensus Layer Reconstruction Beam Chain: The Ultimate Path or a Technical Maze?
[Bitpush Daily News Highlights] Goldman Sachs: Stock sell-off expected to reach $40 billion next week; Jefferies report: Tether's gold reserves reach 116 tons, making it one of the world's largest non-sovereign gold holders; TechCrunch: Prediction market Kalshi raises $1 billion, valuation reaches $11 billion