Date: Sat, Nov 08, 2025 | 12:30 PM GMT
The cryptocurrency market continues to highlight strong performance as the price of Ethereum (ETH) jumps more than 4 percent today, allowing several major altcoins to show signs of strength — including Sei (SEI).
SEI is up with 19% jump and more importantly, its technical setup is showing signs of a possible bullish reversal. The chart now reveals a key pattern formation that could set the stage for an upside breakout in the coming sessions.
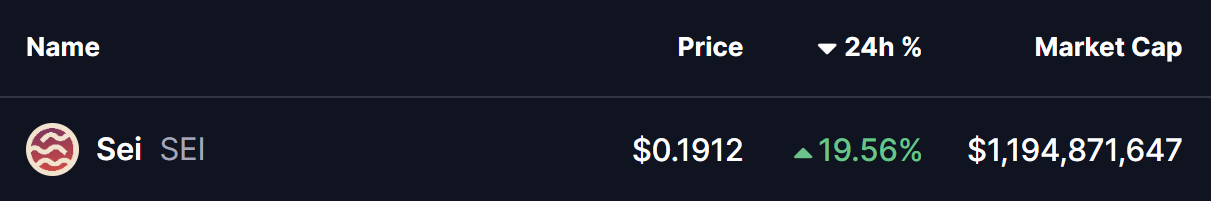 Source: Coinmarketcap
Descending Broadening Wedge Pattern in Play
On the 4-hour chart, SEI has been trading within a descending broadening wedge — a bullish reversal pattern that often forms during corrective phases and signals increasing volatility followed by an upward breakout.
During the latest pullback, SEI revisited the lower boundary of the wedge near $0.1485, a level that has repeatedly acted as a critical support zone. Buyers stepped in aggressively at this area, triggering a rebound that pushed the token back toward $0.1914, placing it close to the wedge’s upper resistance trendline.
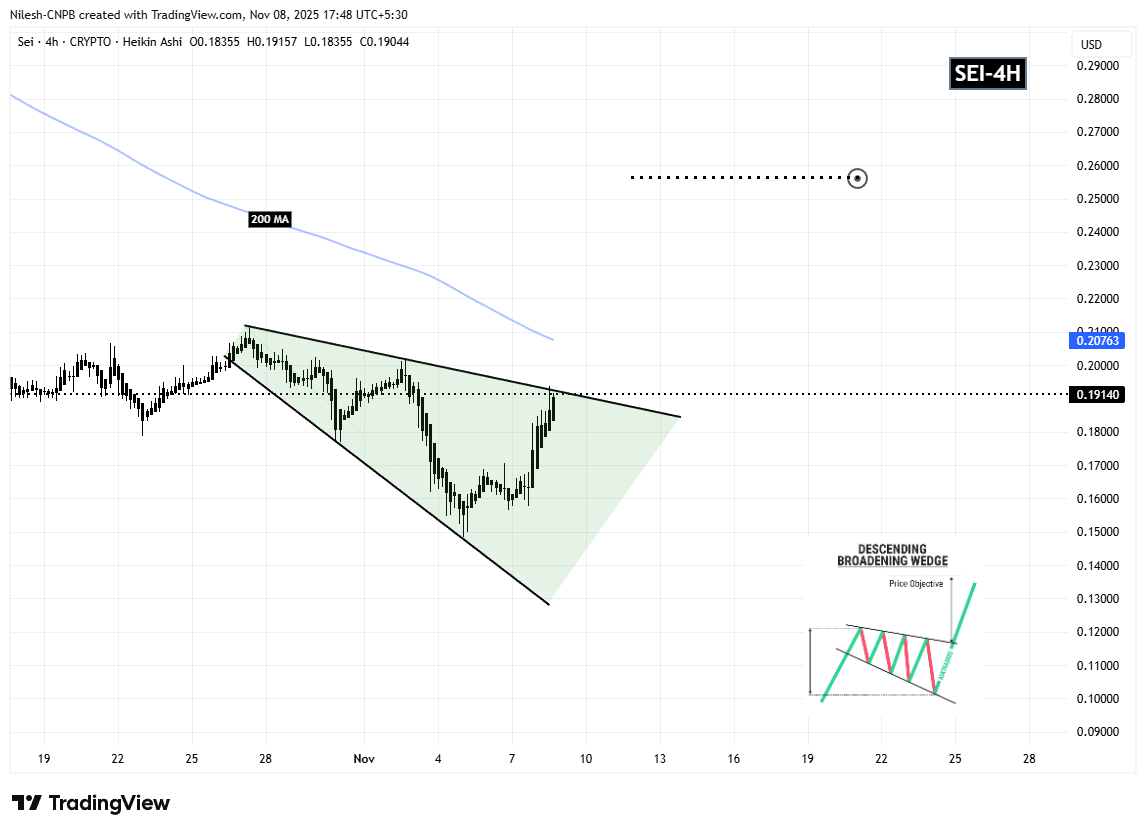 SEI 4H Chart/Coinsprobe (Source: Tradingview)
This tightening price action near the top boundary indicates rising momentum and growing pressure for a potential breakout.
What’s Next for SEI
If buyers manage to break SEI above the upper wedge trendline and reclaim the 200-day Moving Average near $0.2076, it would signal a confirmed bullish breakout. In that scenario, the next logical technical target lies near $0.2565, which represents approximately a 33% upside from current price levels.
However, if SEI faces rejection at the resistance zone, the token may continue to consolidate within the wedge. In such a case, $0.1688 remains the key short-term support to watch.
For now, SEI’s technical structure looks constructive. With the descending broadening wedge still intact and buyers showing strength at support, the setup suggests that a meaningful breakout attempt could soon unfold — especially if overall market sentiment improves through November.