Key points:
Bitcoin liquidity games continue as pressure mounts on $100,000 support.
Signs of price forming a higher low combine with RSI strength slowly increasing.
A Bitcoin “bottoming phase” is now in progress, new research says.
Bitcoin ( BTC ) threatened $100,000 support again Friday as bulls hoped for a higher low.
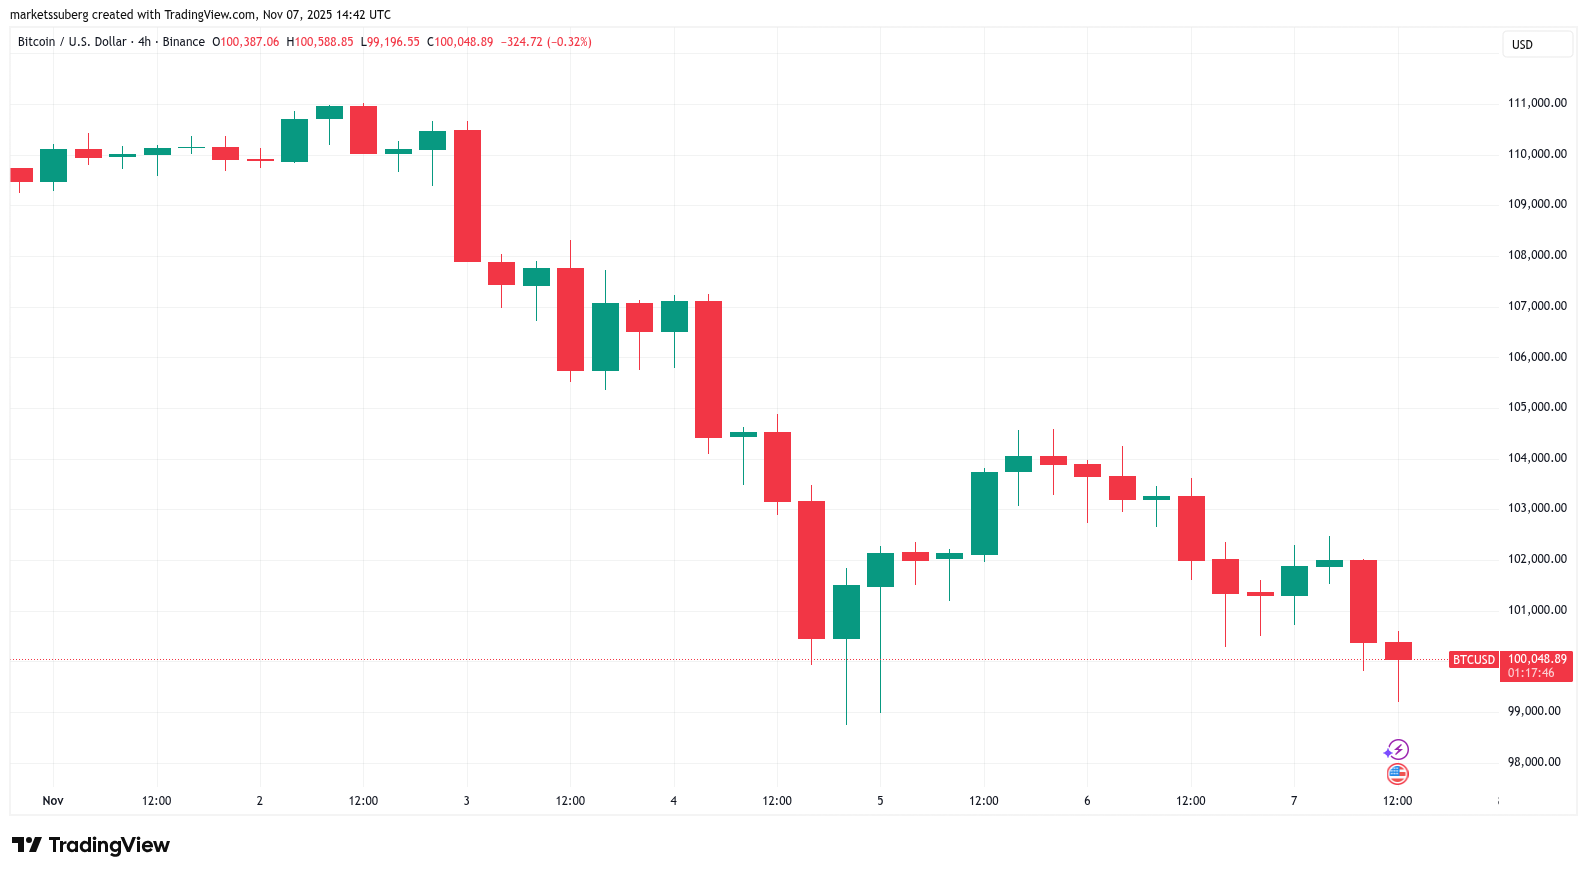 BTC/USD four-hour chart. Source: Cointelegraph/TradingView
BTC price falls victim to “liquidity herding game”
Data from Cointelegraph Markets Pro and TradingView showed BTC price action retreating to near $99,000 around the Wall Street open.
After failing to secure a major relief bounce from multimonth lows, BTC/USD continued to put pressure on bulls and late long positions.
Data from monitoring resource CoinGlass put 24-hour crypto long liquidations at over $700 million at time of writing.
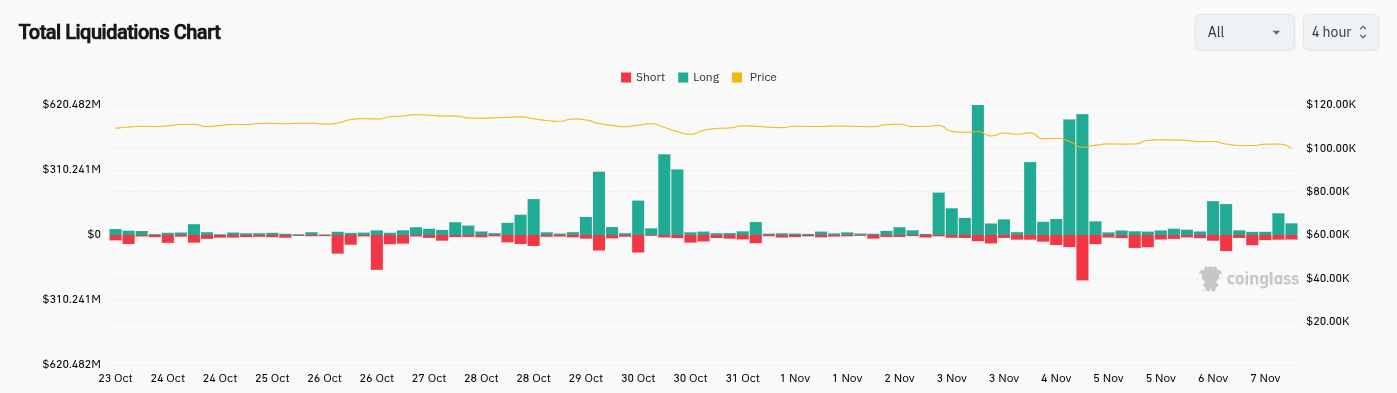 Total crypto liquidations (screenshot). Source: CoinGlass
Liquidity continued to form above and below the price, with large-volume traders potentially attempting to influence short-term movements.
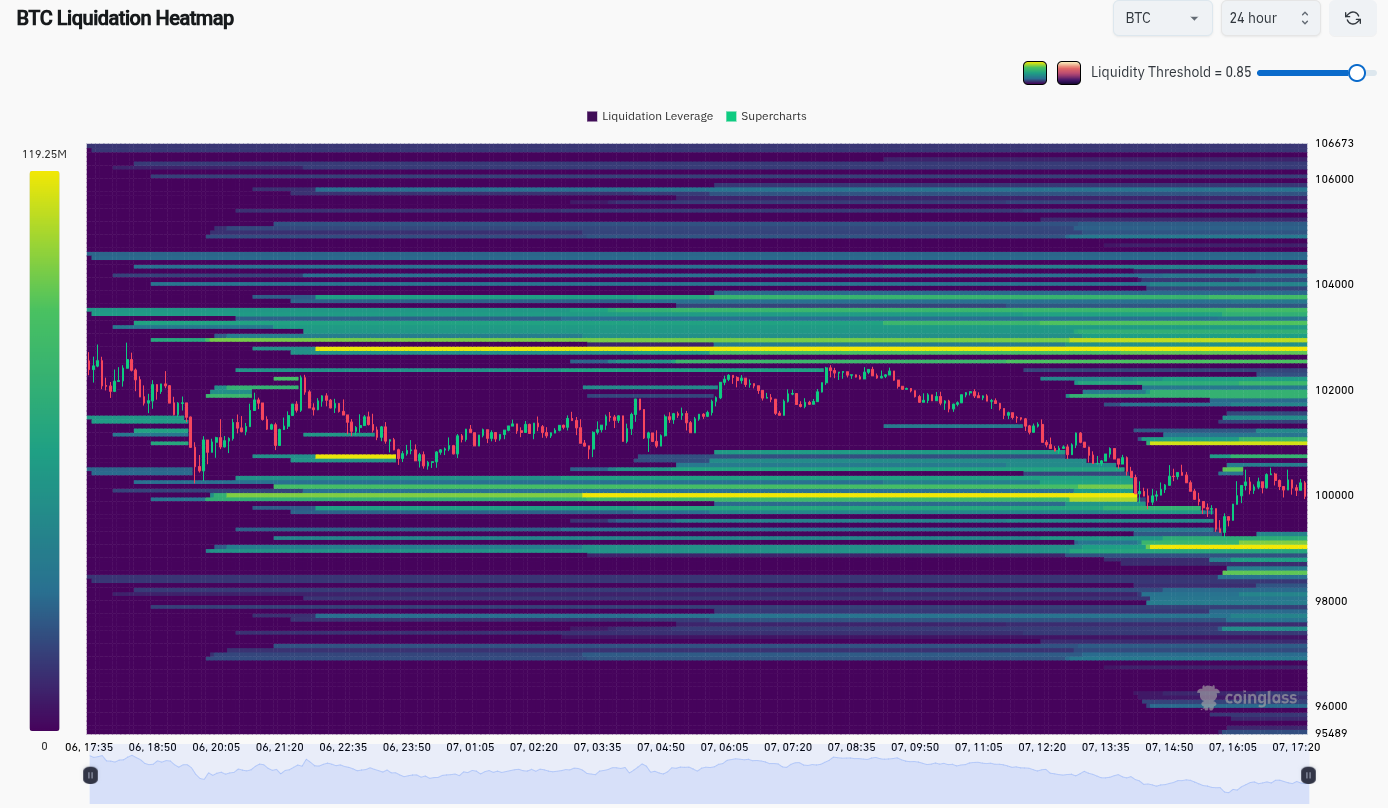 BTC liquidation heatmap (screenshot). Source: CoinGlass
“FireCharts shows $57M in $BTC bid liquidity showing up as plunge protection at $99k,” trading resource Material Indicators wrote on X, alongside data from one of its proprietary trading tools.
“Not convinced they want to get filled. This feels like another round of the liquidity herding game. Watching to see if it moves up with price, or rugs if price reverts.”
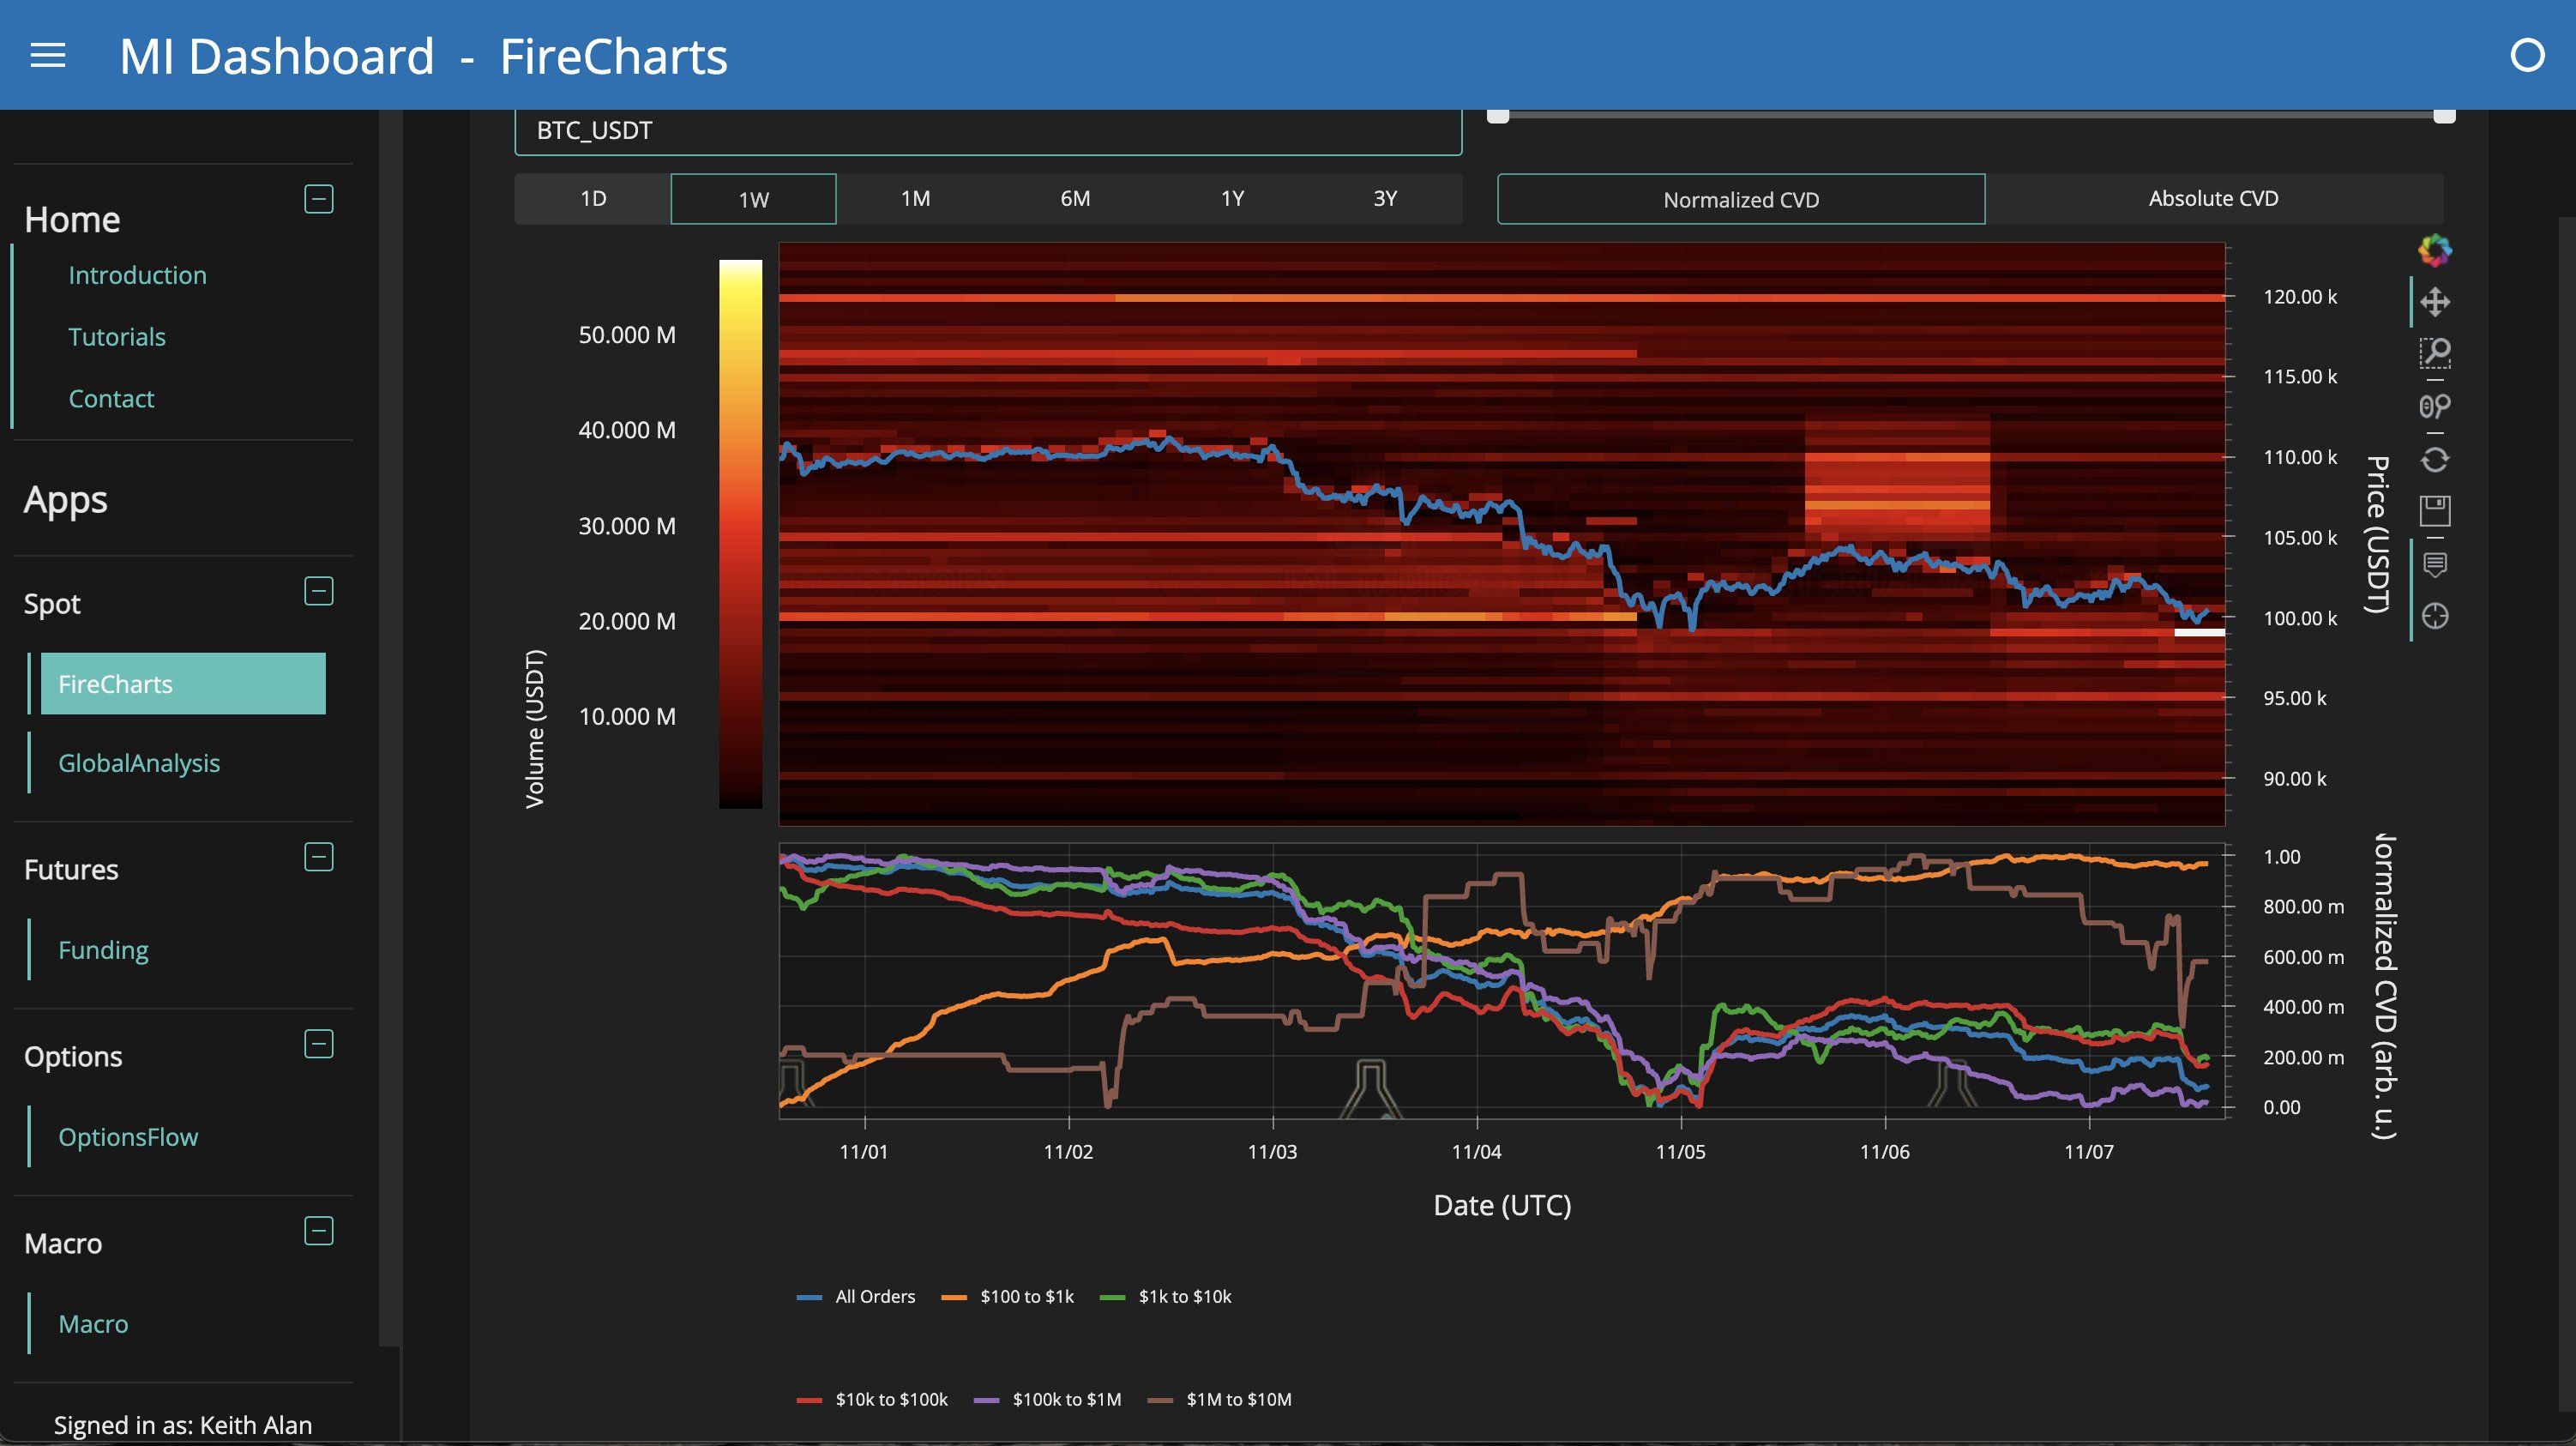 BTC/USDT order-book data. Source: Material Indicators/X
Commentator Exitpump meanwhile eyed open interest (OI) for signs of a low time frame recovery.
$BTC Another round of big OI increase, shorts were in control, but not for longer, price is bouncing back from large bids, some signs of strength that can lead to proper short squeeze, NYO will be important. pic.twitter.com/rowlJKvsbA
— exitpump (@exitpumpBTC) November 7, 2025
On the hourly chart, the price attempted to form a higher low, while the relative strength index (RSI) data also showed a rebound forming from the “oversold” 30/100 boundary.
“It's either carving out a higher low here or we got one more stab lower left to clean up the lows + take out the remaining longs,” trading account CRG wrote , warning that BTC/USD had yet to display any strength.
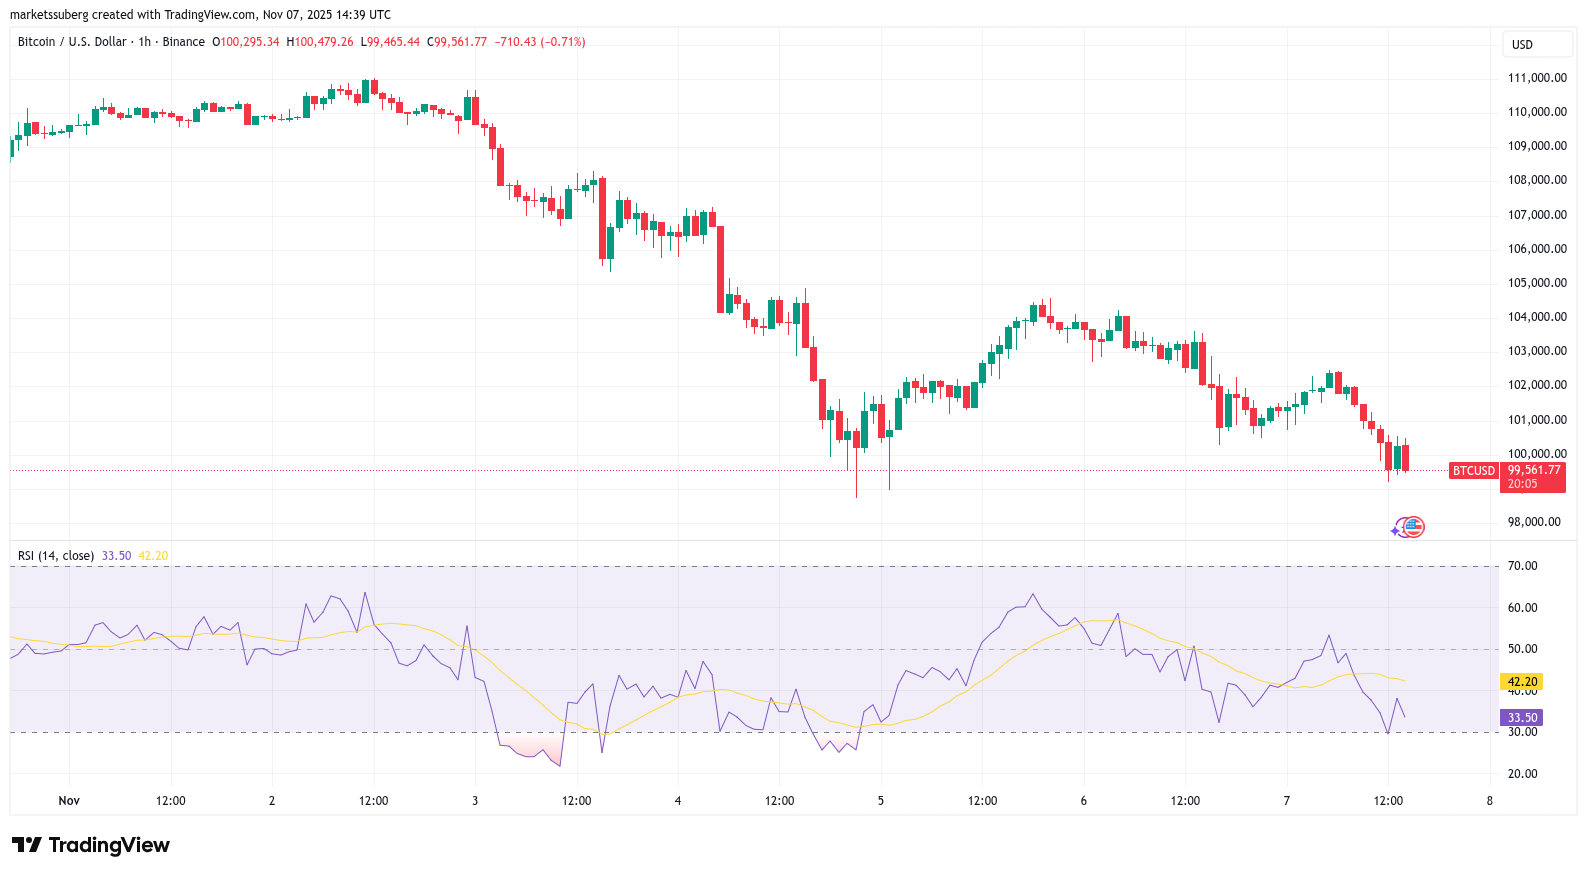 BTC/USD one-hour chart with RSI data. Source: Cointelegraph/TradingView
Little needed to start “next rally” on Bitcoin
Summarizing the current market, onchain analytics platform CryptoQuant concluded that Bitcoin was in a “bottoming phase.”
Related: Bitcoin price 21% dip ‘normal’ as accumulator wallets buy 50K BTC in day
Several charts supported its thesis, including cumulative volume delta (CVD) on Bitcoin futures.
“Speculative selling pressure is fading,” contributor Sunny Mom wrote in one of its “ Quicktake ” blog posts on the day.
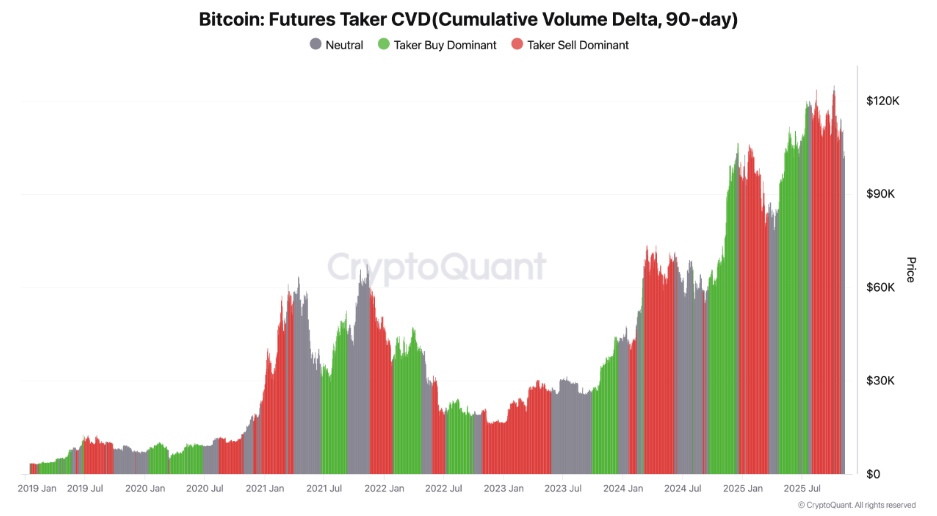 Bitcoin futures 90-day taker CVD (screenshot). Source: CryptoQuant
While spot CVD was still “slightly bearish,” a lack of mass forced selling among traders pointed the way to market relief, Sunny Mom said.
“In short: this still looks like a bottoming phase. A bit of good news may be all it takes to spark the next rally,” the post read.